
Data Viewer Pages
Viewer Access
The Data Viewer is freely available to all users wishing to view publicly available data without an account.
By opening a free Synoptic account, users gain access to unlimited saved favorites and the transfer transfer of settings across devices in the Data Viewer. A free account also opens access to Synoptic’s Data Download Service. You can sign up for an account by selecting the avatar in the upper right corner of the application, and clicking ‘Sign up’.
Explore
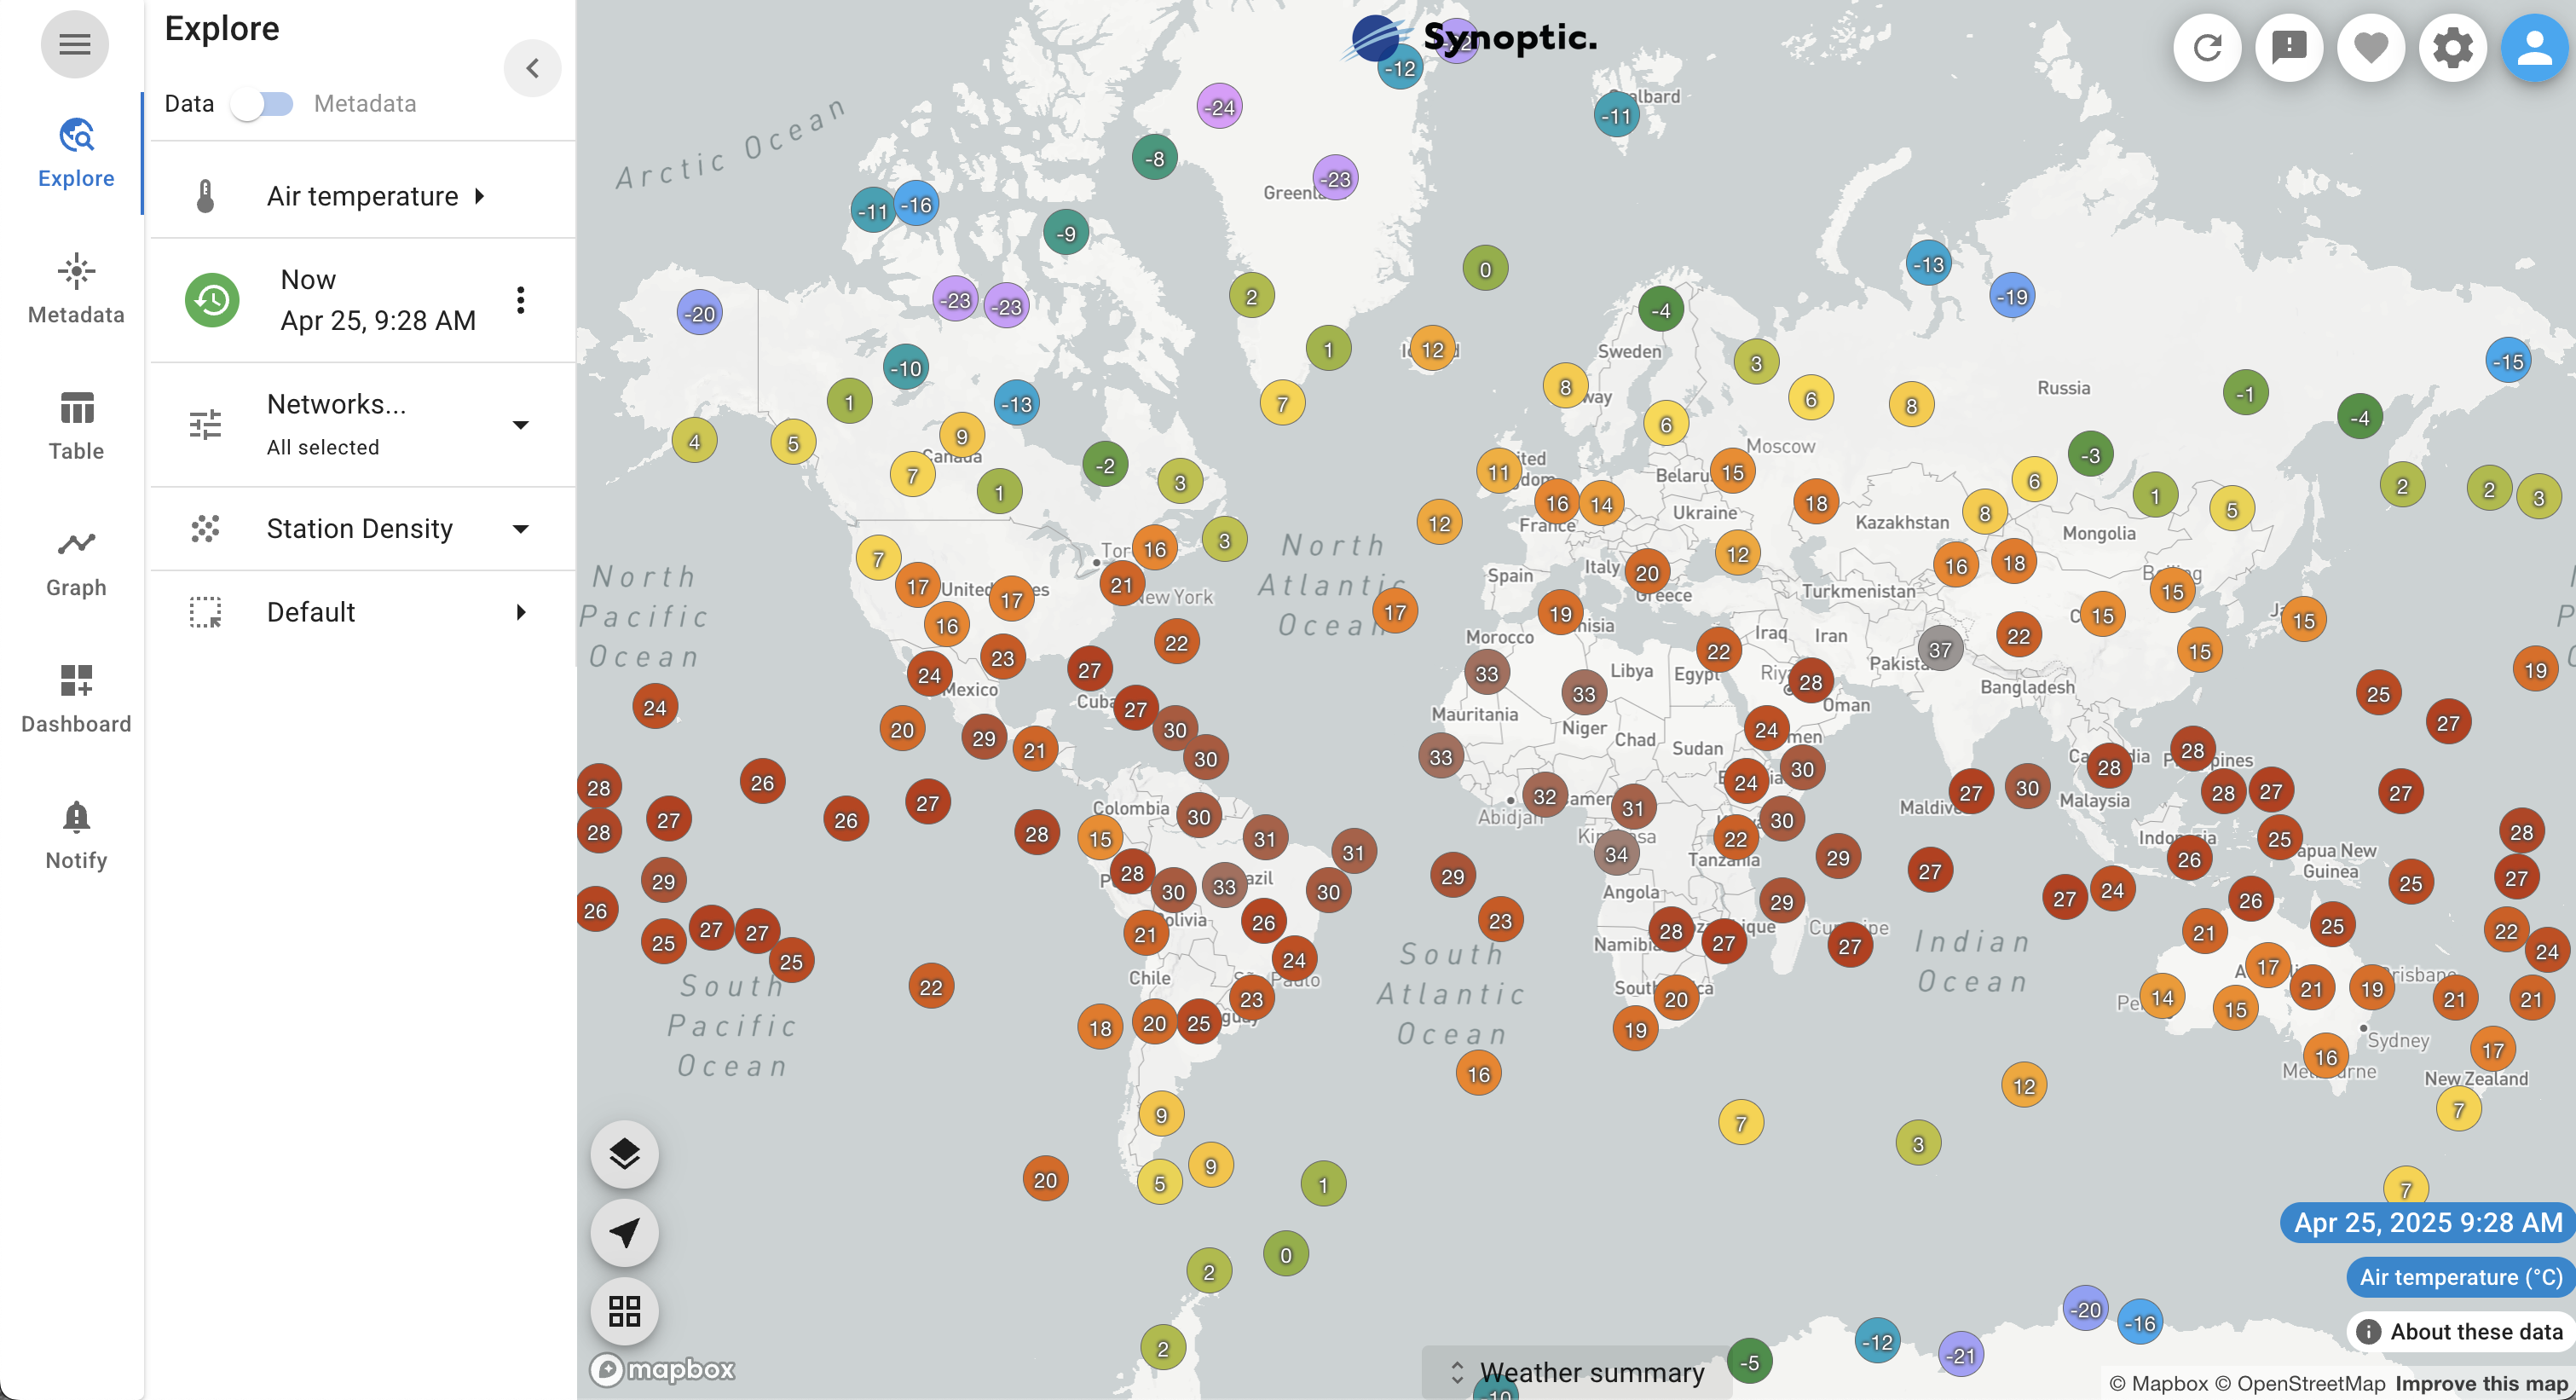
The Explore page is your source to view map-based snapshots of conditions across your interest area, displaying data values on the map at the reporting station’s location. We apply a station thinning algorithm to maintain a clear view of station conditions. If the station density seems sparse, zooming in will update the view with additional stations. Clicking on a station displays a popup with a Conditions tab that presents a table of the most recent observations and timeseries chart of recent conditions (the duration is adjustable in the Global Settings). Select the About tab to view basic station and sensor metadata.
Data filtering and selection
The default display is real-time temperature across all public networks. Using the Explorer menu pane you can quickly adjust the display by changing variables, time, and filter to specific networks of interest with just a few clicks.
Variable
Selecting the active variable from the menu pane allows you to choose from a selection of variables in Synoptic’s system. We’ve prioritized common variables and are always adding more in response to user feedback. If you don’t see the variable you’re looking for, please contact us and let us know!
Time Mode
In addition to real-time observations, you can also display a historical snapshot of data. Toggle from “Now” to “Historic” mode and select any date and time (UTC or user-local) spanning our entire period of record (1996). All the data is equally accessible.
Network Selection
In addition to mapping observations by variable and timestamp, you can also filter by network. By default, all networks are shown, however you have the ability to chose the type of networks you’d like to see, or specify one or more networks yourself. “Use by group” filters by preselected groups that work well together or are similar in observing purpose. “Custom” allows you to select by one or more networks, you can look up networks by their long or short names given here.
Weather Summary
Stations of interest can be added to a ‘Weather Summary’ table to facilitate panning of conditions on the map while retaining a summary view of specific stations of interest. Stations can be added in two ways:
add all stations in the map view by selecting the ‘Weather Summary’ button at the bottom of the application, and select ‘Add current stations on the map’.
add individual stations by selecting a station marker on the map and check the box to add the station to the weather summary
The weather summary table permits comparison of the latest observations from all selected stations alongside the minimum and maximum values since the previous day. Links to display tabular data or plot a meteogram for each station are also available.
Metadata
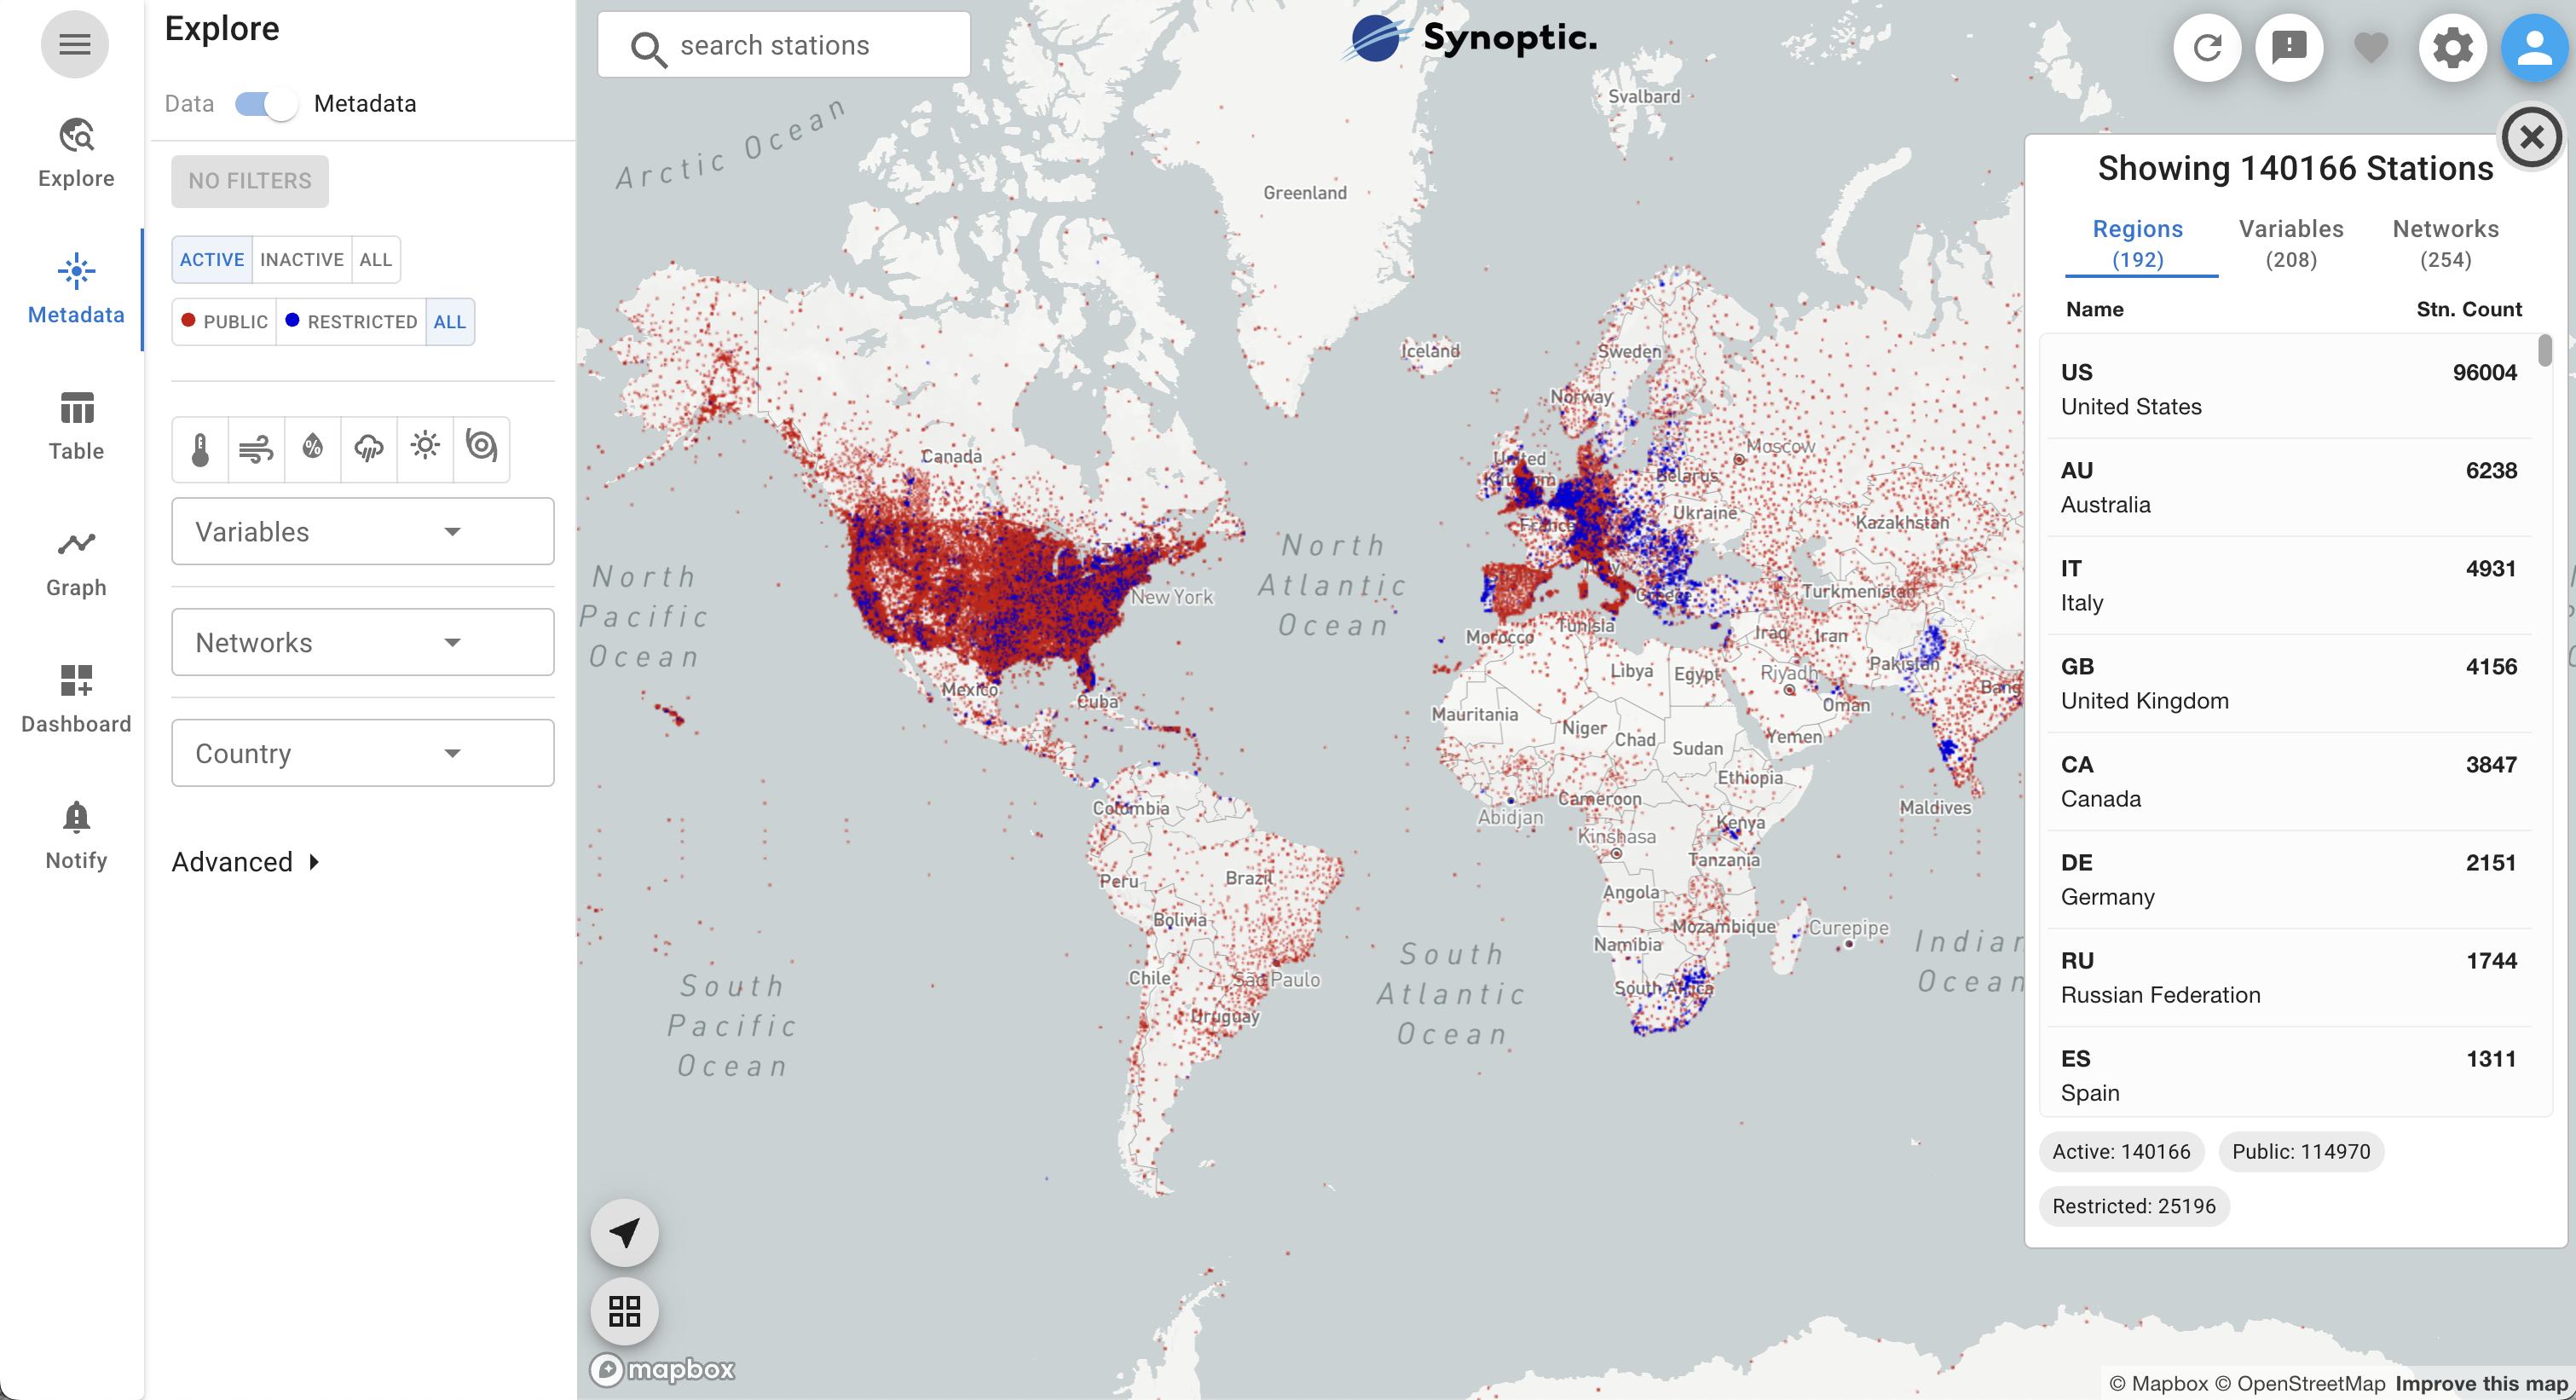
The Metadata page provides tools to quickly explore the entire catalogue of data aggregated by Synoptic. Contrary to the Explore page, which applies spatial filters in order to preserve a clean viewing experience for tracking conditions, the Metadata pkage displays all stations in Synoptic’s system. Filter assets by status (actively reporting or inactive), variables of interest, period of record, and more. Station markers on the map can be clicked to view additional station metadata.
The Metadata page’s station search functionality is also an excellent tool for quickly finding a specific station of interest, and supports search by ID or station name keywords. This is the most efficient way to find a single station, and users can navigate to current data by clicking the tabular data link(![]() ) in the station’s metadata panel.
) in the station’s metadata panel.
Table
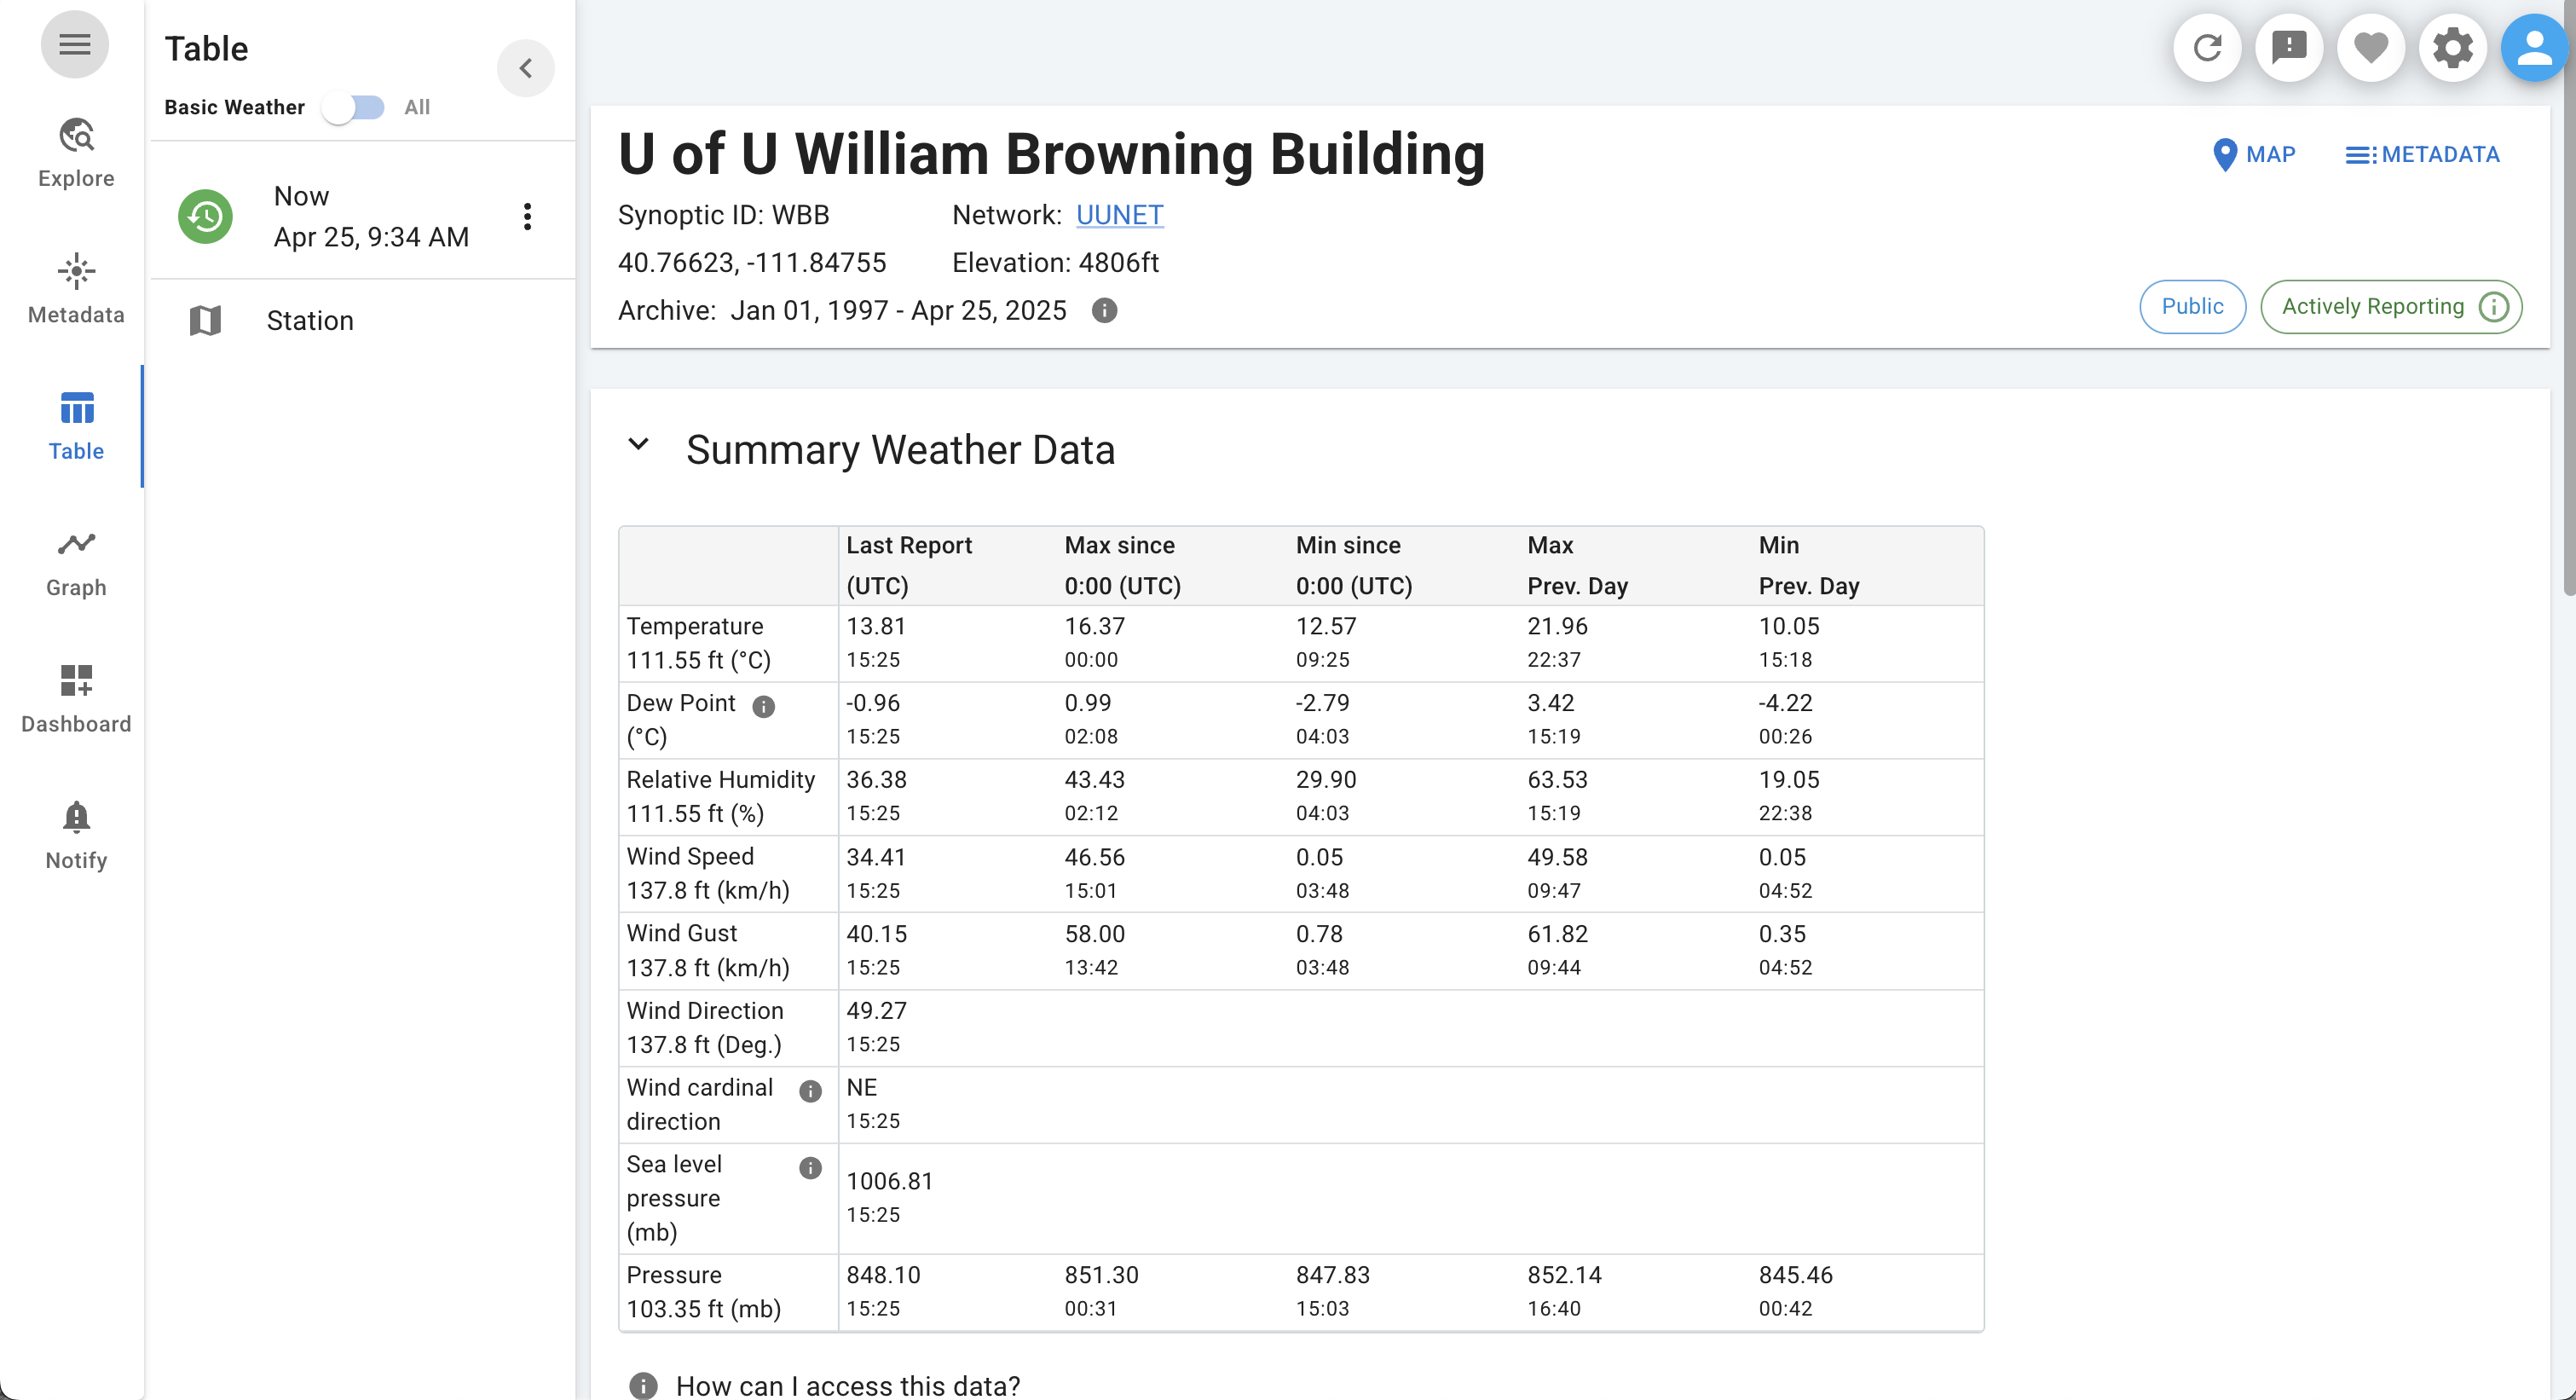
The Table page is your source for tabular data at a single station of interest. Access the Table page for a station by selecting the station of interest from the Explore page and then clicking the table page icon (![]() ) from either the navigation pane or the station data panel. You can also select a station from the Table page menu drawer.
) from either the navigation pane or the station data panel. You can also select a station from the Table page menu drawer.
The Data Viewer’s default display is limited to a common set of ‘Basic Weather’ variables to streamline presentation. To view all variables for a station, toggle the ‘Basic Weather’ variable group to ‘All’ under the Table menu header to the left of the display. You can also change the variable group in the Global Settings.
Basic metadata for the station is displayed in the Table page. For comprehensive metadata, select the Metadata link (![]() ). You can always click the tabular data icon (
). You can always click the tabular data icon (![]() ) to return to the default data view.
) to return to the default data view.
The Summary Weather Data table provides a summary of the most recent station report along with minimum and maximum values for the current and previous day (minimum and maximum values are only displayed in the ‘Now’ time mode). If the time mode is ‘Historic’, the table will populate with the station report at the closest date time to that specified. If the station reports precipitation, precipitation accumulations over the 1, 3, 6, 24, and 48 hours leading up to the specified date/time stamp are also displayed.
Hovering over “How can I access this data?” will provide the exact Weather API query used to power a table and a link to the Data Download tool to save the data.
The Station Data table displays the station time series data over the duration specified by Global Settings ‘Duration’. Within the table, observations flagged by Synoptic’s QC processes are displayed in yellow. Hovering over the yellow flag displays the name of the QC check (more information about QC).
Graph
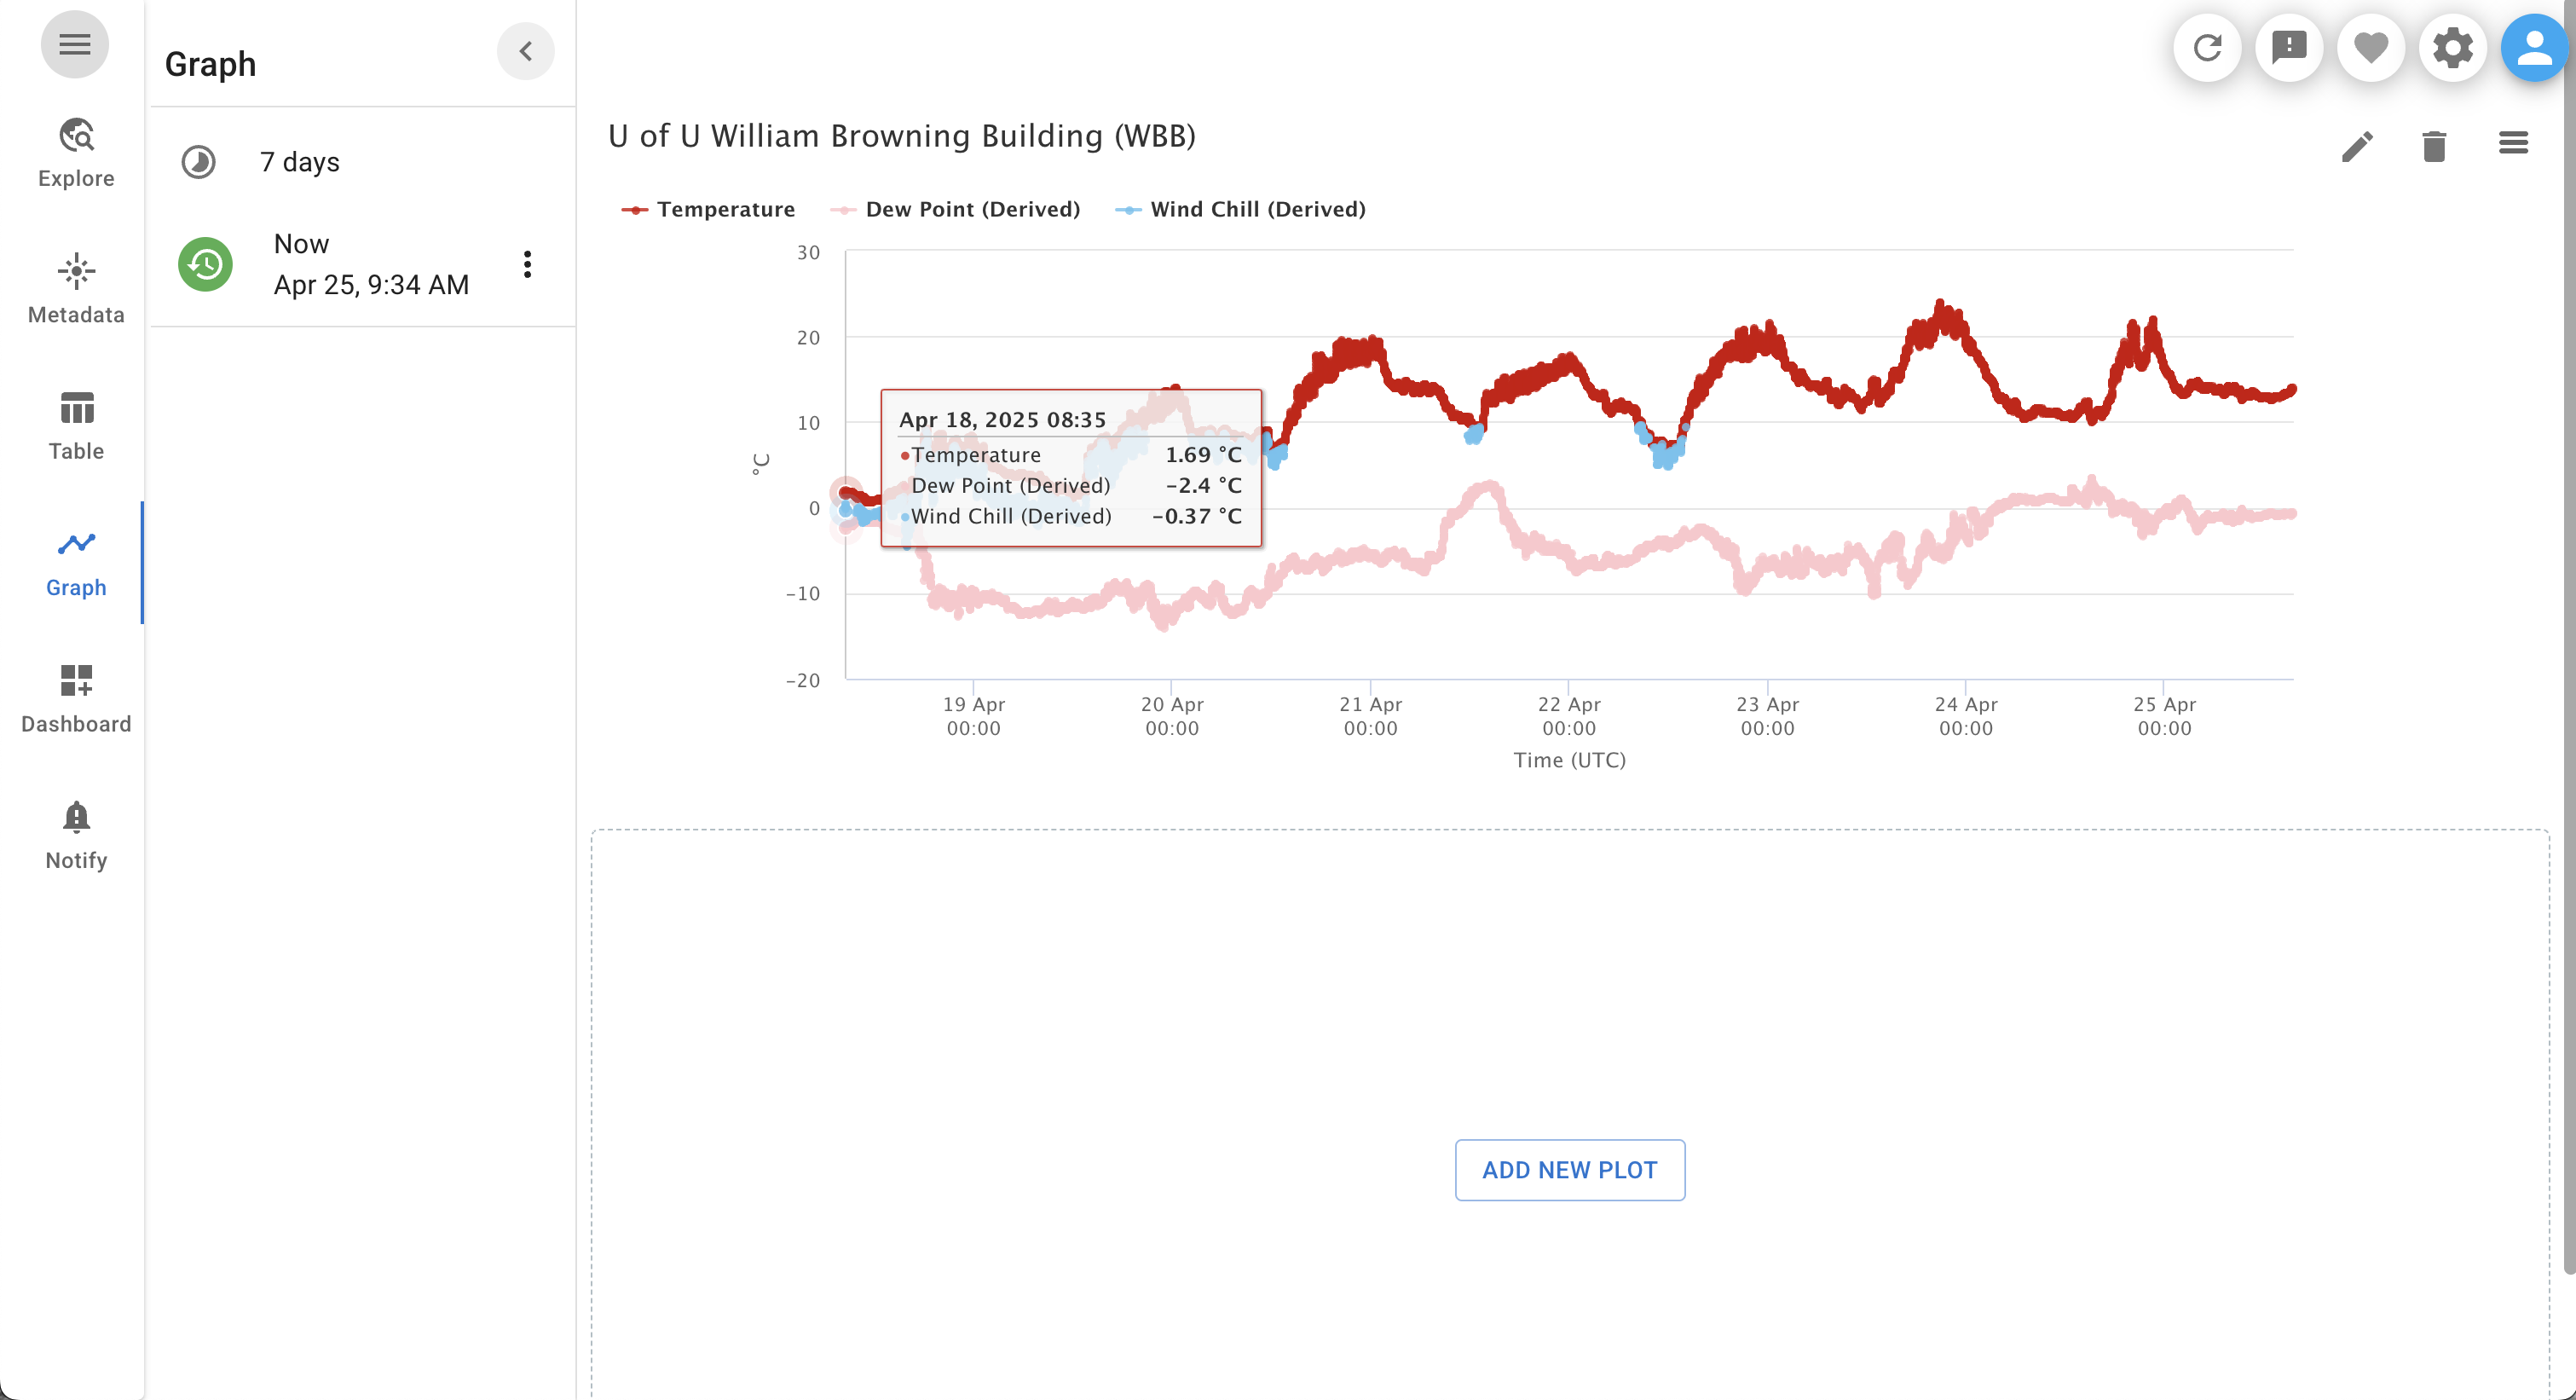
The Graph tab allows the user to specify a date and time ('Now' or ‘Historic’) and create a timeseries graph for up to 7 days, ending on the specified date time. To begin, click “Add New Plot”. From there, the user can choose to graph one or more variables for a single station or a single variable for up to 4 stations by selecting the tab corresponding to the desire plot type. Variable(s) can be selected from the pre-defined variables or searching for variable (list of available variables and their Synoptic callable names). Stations can be selected from the map by clicking on a station and can be filtered by network.
Graphs are interactive and can be edited and downloaded to be shared or used in other applications. As with other Data Viewer pages, graphs are encapsulated by the url, which can be shared with other users.
Four graphs can be displayed at one time, whether or not they are single/multi station graphs.
Dashboards
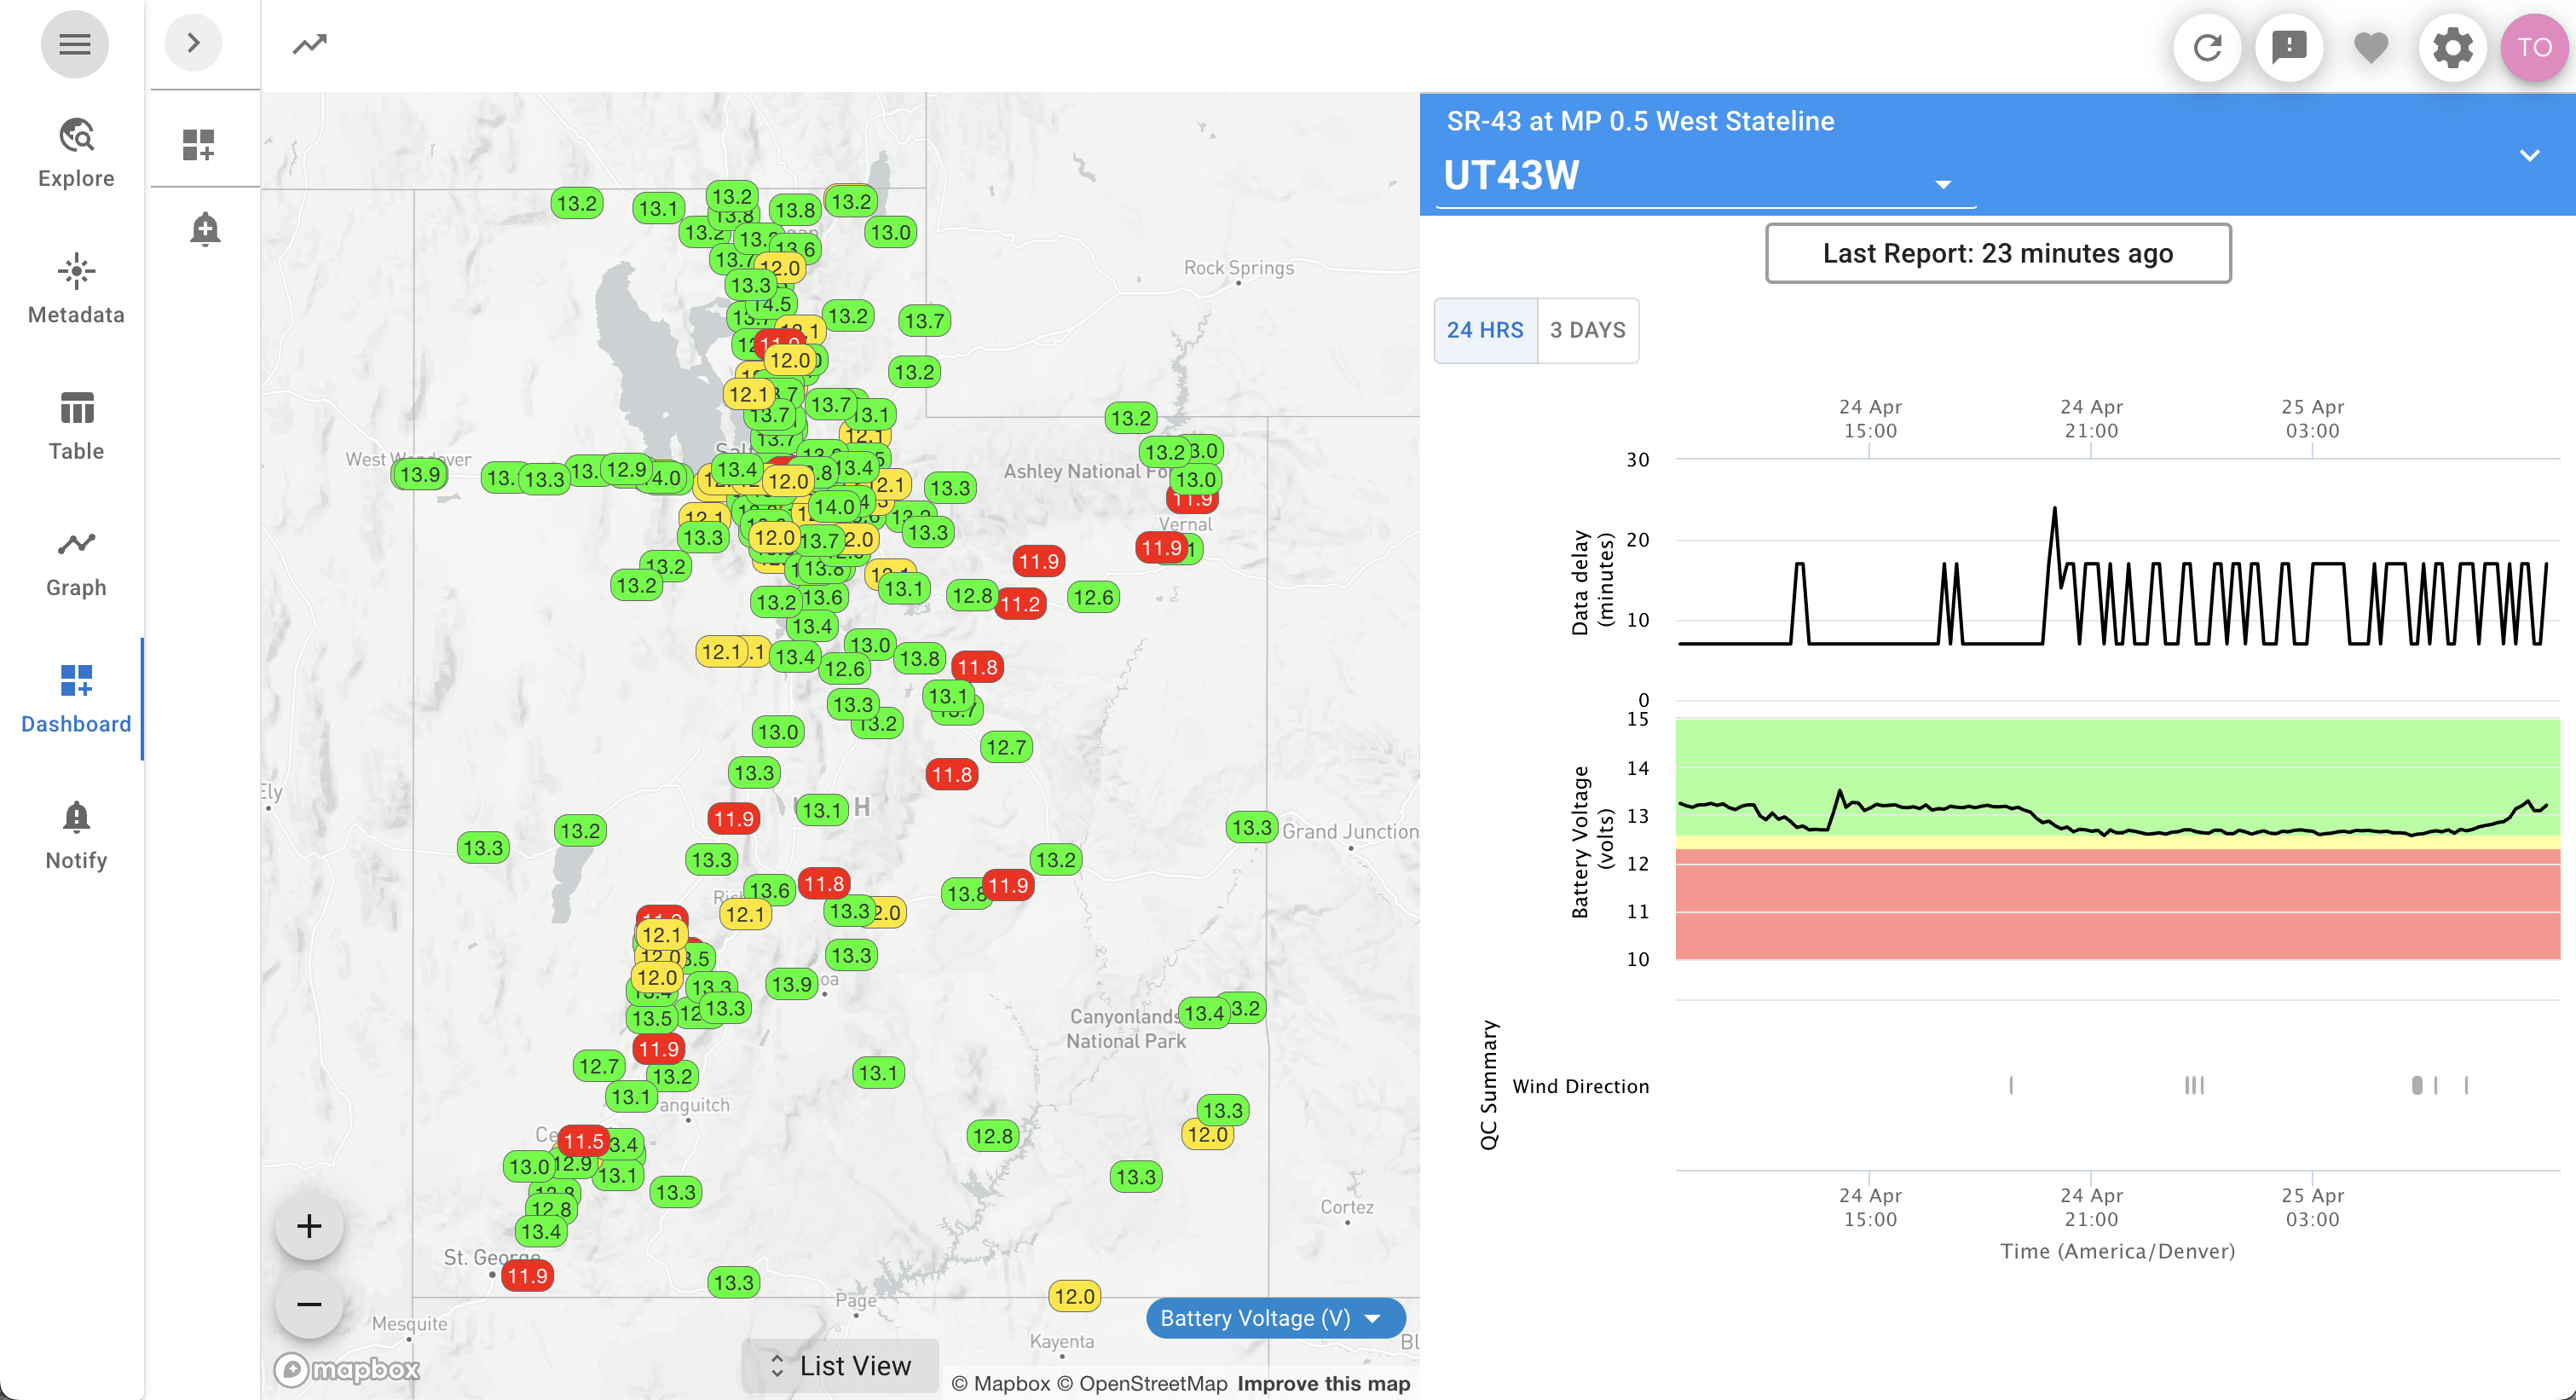
The Dashboard page is part of the paid Dashboards and Notifications service in the Data Viewer. Users can create dashboards for selected stations and variables and view all conditions in a centralized page. Get a quick summary of station conditions with variable tiles and toggle between map and table displays of current conditions for all selected stations. A station status page can be accessed by clicking the monitor icon (![]() ), and displays station reporting information, battery voltage, and quality control summary for monitoring station performance.
), and displays station reporting information, battery voltage, and quality control summary for monitoring station performance.
Dashboards also provide the starting point for generating Notifications based on station reporting frequency and environmental conditions. Contact us to learn more about Dashboards and Notifications!
Notifications
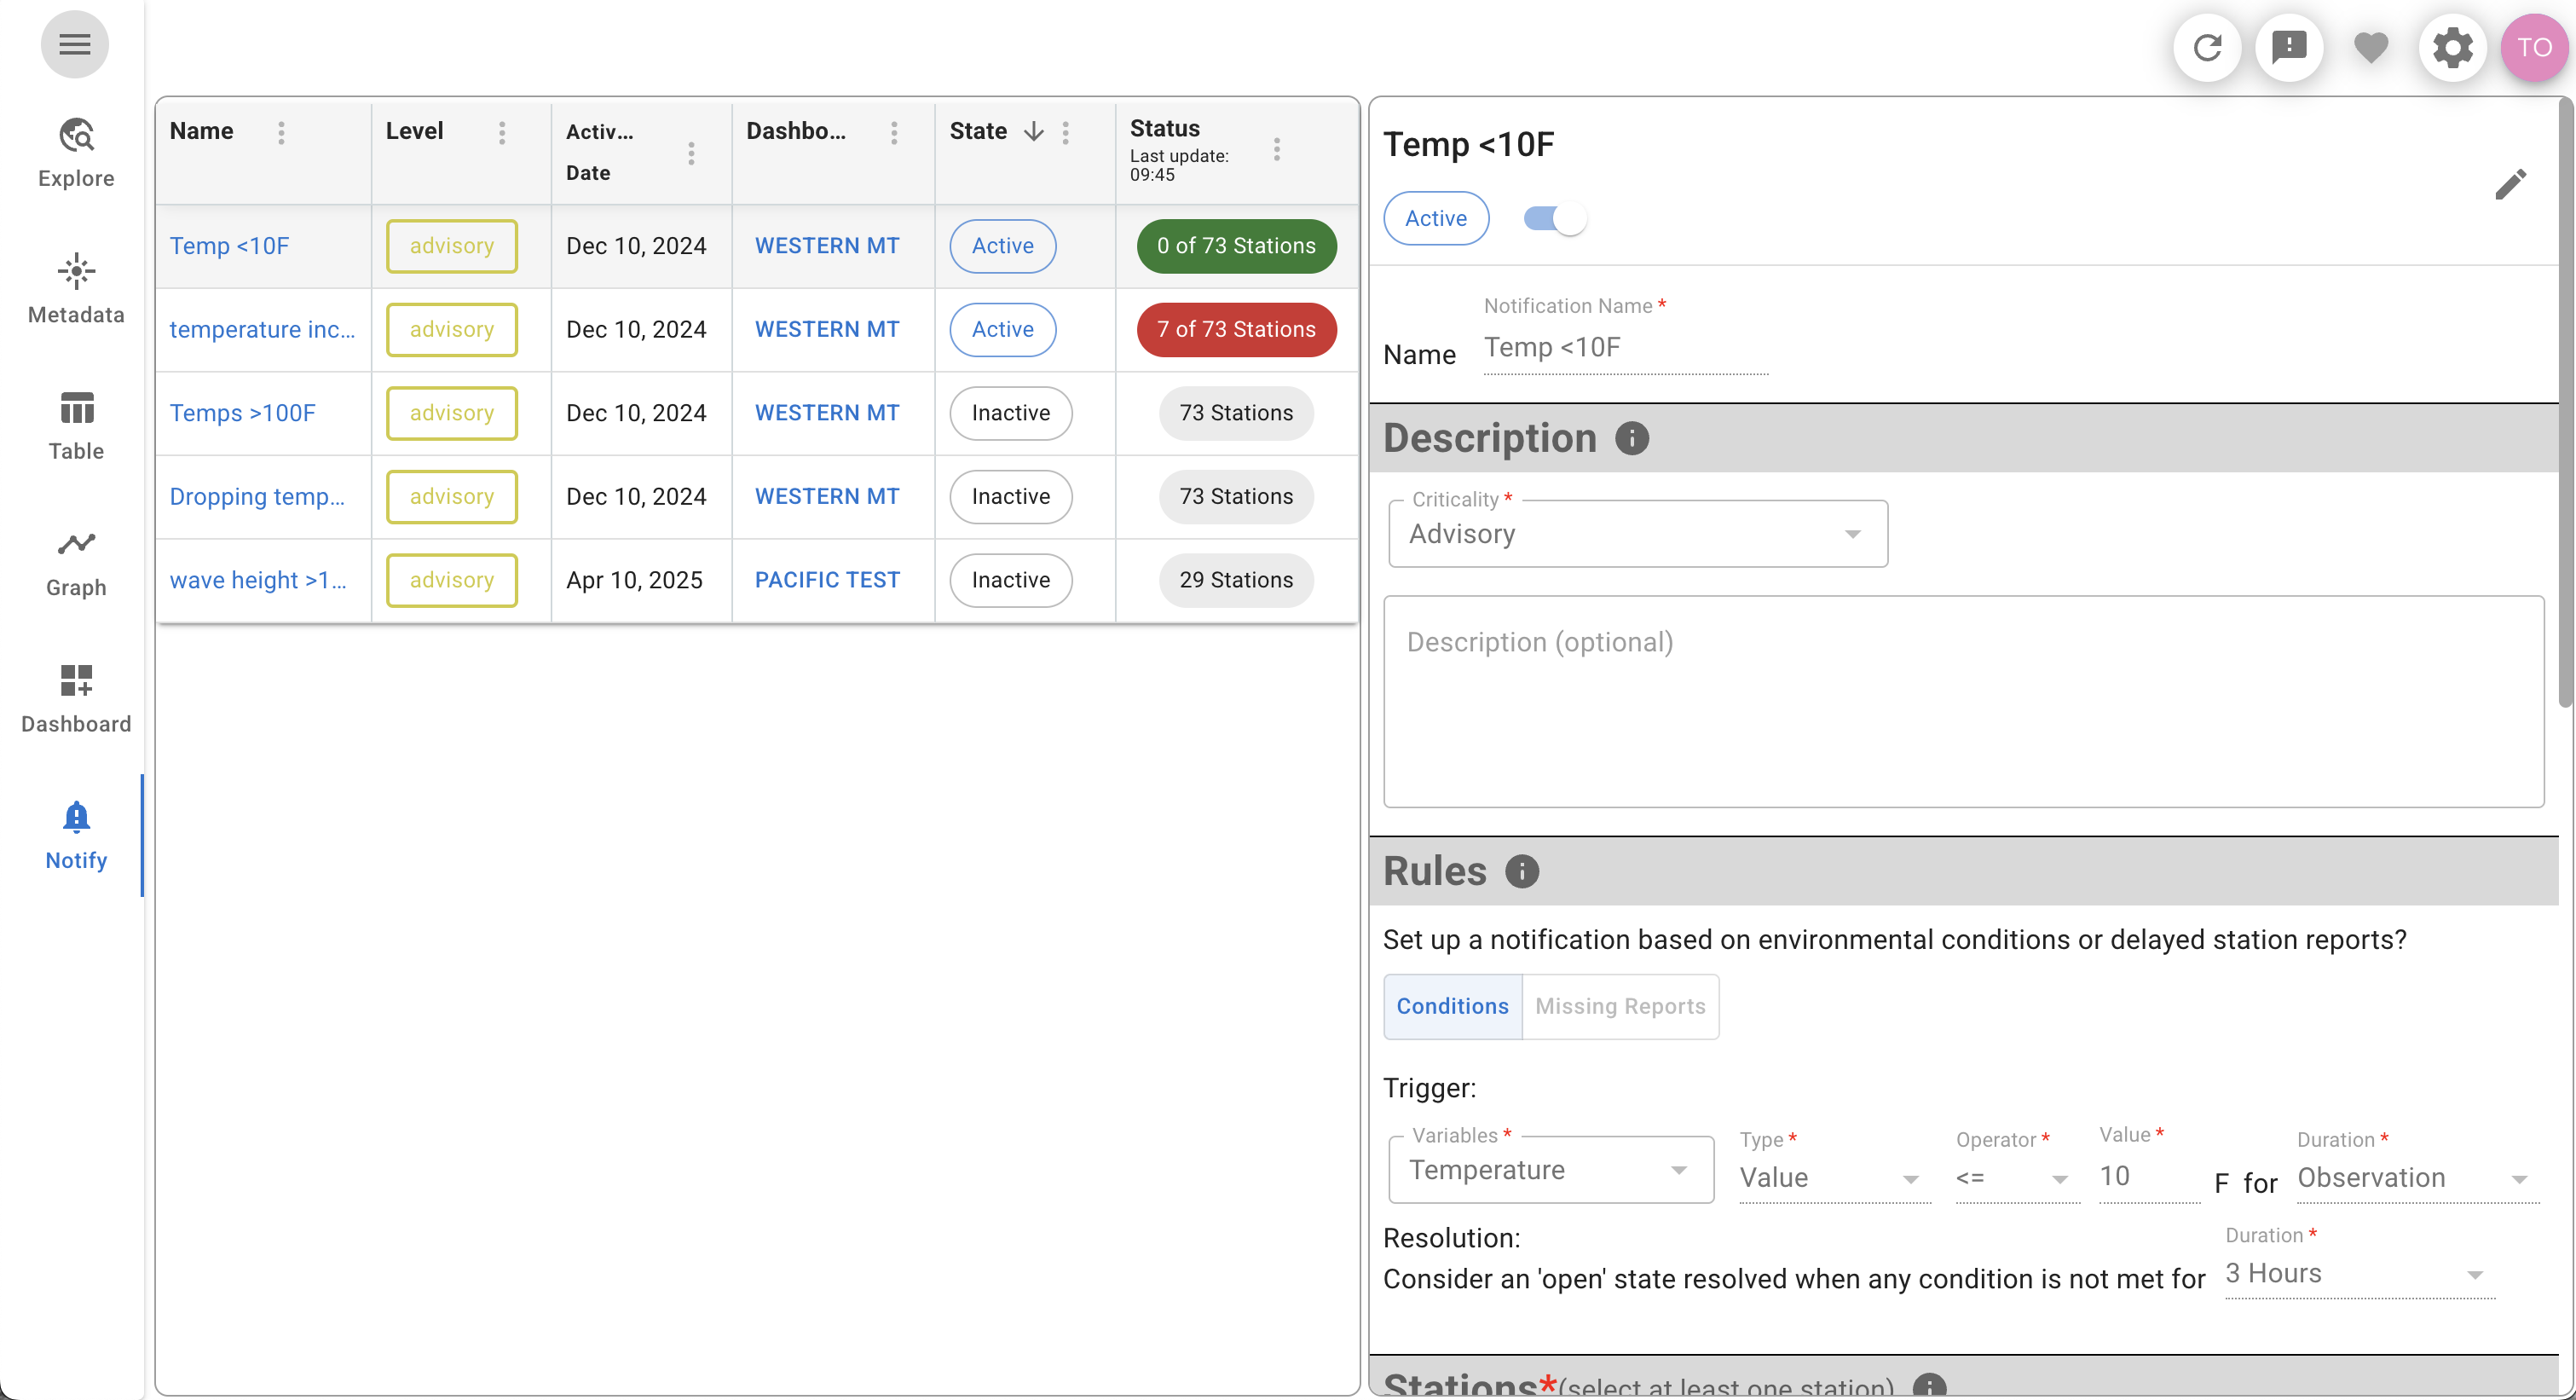
Data Viewer Notifications are integrated with Dashboards as part of the Data Viewer’s paid service. The Notifications page provides a summary of all active and inactive Notifications created by the user. Active stations display the number of stations presently in alert. Existing notification details can be reviewed by selecting one from the summary table. Notifications can also be modified by selecting the edit icon (![]() ).
).
Creation
Notifications are created from the Dashboards page. The stations and variables in the selected Dashboard form the basis for creating a notification. While on the desired dashboard, click the add-alert icon (![]() ) to create a new notification. The new notification form allows you to name and describe the alert, select a criticality level, define the alerting ruleset and terms for alert resolution, select stations from the dashboard to be alerted on, and distribution forms (email, SMS text, or only display in the dashboard).
) to create a new notification. The new notification form allows you to name and describe the alert, select a criticality level, define the alerting ruleset and terms for alert resolution, select stations from the dashboard to be alerted on, and distribution forms (email, SMS text, or only display in the dashboard).
Notification Rules
Notifications rules can be based on one or more environmental thresholds, or elapsed time since the station reported. Alerts on environmental thresholds can be triggered on a single observation, or consistent exceedance of the specified threshold for defined time period in order to minimize the risk of repeated alerts when conditions fluctuate about the defined threshold. Similarly, users have the flexibility to define the terms of alert resolution (a single observation or based on multiple observations over a specified time interval).
Notification Distribution
Users can choose to distribute alerts via email or SMS text. Distribution is optional; if no distribution is selected then stations in alert will only be communicated within the dashboard itself.
If email or SMS text distribution is specified, users can select whether or not to receive notifications on alert resolution, and choose to receive periodic reminders of stations in alert for long-running alerts.
Confirming Notifications
After creation of a notification, users can choose to confirm (ie. save) the notification but leave it inactive, or confirm and activate. The options are designed to allow users to create a new notification even if they are already at their active notification limit as defined in their contract. Notification status can be changed from the Notification page summary table.