
Synoptic Data QC
Introduction
The /timeseries, /latest and /nearesttime API services provide Synoptic QC (i.e. data checks) as additional attributes delivered alongside the data. QC is performed immediately when new data is received, and is available for “real time” data in addition to historical data.
Examples applying a suite of Synoptic data checks are shown below. API users can elect to return these flags alongside the data, or to automatically remove flagged data.
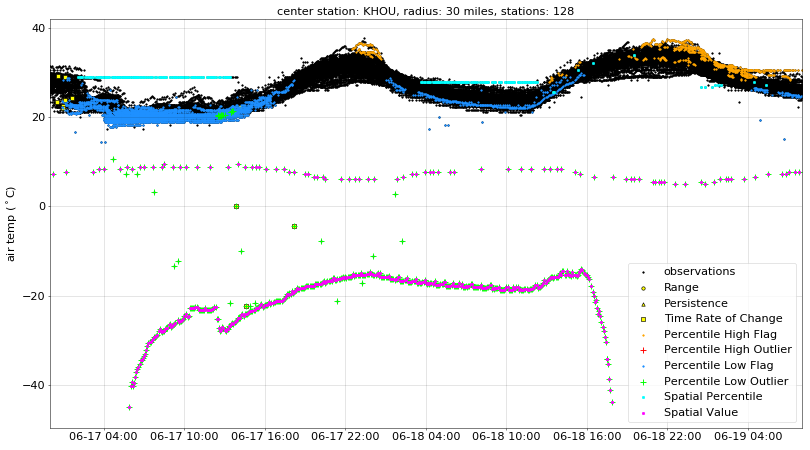
Air temperature observations during June, 2019 for a 30-mile radius centered in Houston, TX:
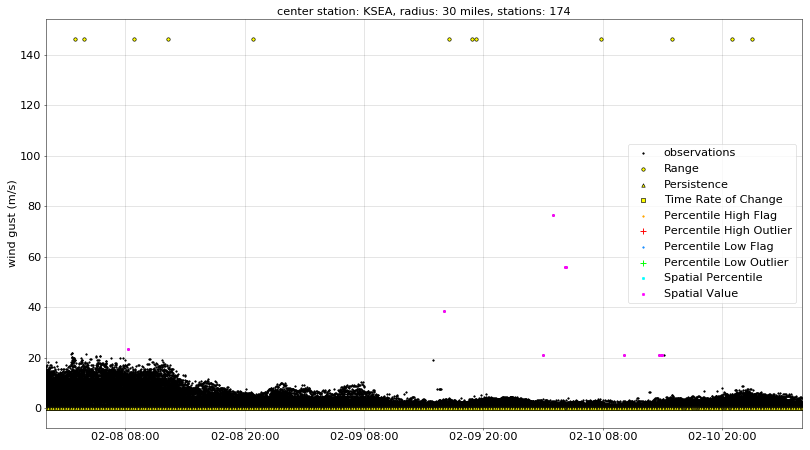
Wind gust observations during Feb, 2020 for a 30-mile radius centered in Seattle, WA:
There are many potential causes of erroneous data: sensor failure, poor sensor siting or calibration, data transmission errors, or incorrect conversion of the transmitted data arising from invalid metadata. The Synoptic data checks are intended to identify: (1) physically implausible values and (2) values that may not be representative of the conditions prevailing at that time (outliers).
Synoptic’s QC can significantly reduce erroneous data, however all data accessible via the Synoptic Weather API must be considered provisional. Official data archives for some networks are available directly from data providers.
Basic QC
Range Check (
sl_range_check)Rate of Change Check (
sl_rate_check)Temporal Persistence Check (
sl_pers_check)Wind Speed vs Maximum Gust Check (
sl_windspd_maxgust_check)Wind Gust Factor Check (
sl_wind_gust_factor_check)Secondary Range Check (
sl_secondary_range_check)Secondary Persistence Check (
sl_secondary_pers_check)Soil Moisture Freezing Check (
sl_soil_moisture_freeze_check)Sensor Status Signal Check (
sl_sensor_status_signal_check)
Note that by default, the range check is automatically applied to remove data from all Weather API requests. In addition, the range check acts as a single entry point, where no further basic or advanced data checks are run after a failed range check.
Advanced QC
Spatial Value Check (
sl_spatial_value_check) (8 variables)Percentile Checks (
sl_percentile_looutlier_check,sl_percentile_hioutlier_check,sl_percentile_loflag_check,sl_percentile_hiflag_check) (air temperature only)Snow Depth History Check (
sl_snow_depth_hist_check)
Basic QC checks are implemented using known physical relationships for each variable (e.g. range, rate and persistence thresholds) and often have defined WMO equivalent standards. Basic checks compare observed data against thresholds or against other variables within a station report, whereas advanced checks leverage secondary derived datasets (e.g. historical percentiles or gridded products), or use spatial comparisons with neighboring stations.
API users can specify individual qc checks, such as qc_checks=sl_range_check,sl_rate_check, or all basic or advanced checks can be enabled with qc_checks=basic or qc_checks=advanced. In most cases, it is best to specify the full suite of Synoptic basic and advanced qc checks with qc_checks=synopticlabs. For additional details on usage, see “Data Checks and Quality Control” in the docs specific to each service.
Note that sl_percentile_loflag_check and sl_percentile_hiflag_check are not included in the synopticlabs suite, such that a user can elect to remove data for all synopticlabs checks without removing any valid observations. In addition, the legacy MesoWest data checks (mw_multvariate_lin_reg_check, mw_24h_wind_persistence_check and mw_uu2dvar_rejection) are not included in the synopticlabs check suite, and must be enabled individually or with qc_checks=mesowest.
Please contact us for additional information on the appropriate application of Synoptic data checks for your use case.
QC via the Weather API
Within the Time Series, Latest and Nearest Time services, users can add QC parameters to their queries to return and optionally apply QC checks. By default, the Weather API doesn’t return data that has been flagged as non-plausible by the Synoptic Range Check.
If the qc parameter is omitted then the API will return data while assuming the following: qc=on, qc_remove_data=on, qc_flags=off and qc_checks=sl_range_check. Note that if the range check removes all values for all requested stations and variables, a response message of “No stations found for this request” will be returned. If the range check removes values only for certain variables, those variables will not be present in the OBSERVATIONS object.
qc(on [default], off), Indicates the application behavior of the QC attributes on the data requested. If set tooffthen all data will be returned without data checks and quality control (not recommended). If set toon, aQC_SUMMARYobject is returned, aQC_FLAGGED: [bool]key will be inside theSTATIONobject, and individual data checks will be in theqcresponse key for each variable within theOBSERVATIONSobject.qc_remove_data(on, off, mark), Indicates the response behavior for an observation that fails a user specified data check. (defaultonifqcparameter omitted, elseoffifqc=on)offreturns the data values even if a data check failure is present for that data.onremoves failed data values, returningnull. If all values for all requested stations and variables are set tonull, a response message of “No stations found for this request” will be returned. If the value for an individual variable is set tonull, the variable will not be present in theOBSERVATIONSobject.markreplaces failed data with a value offalse.
qc_flags(on, off), Indicates whether the data checks are returned alongside any data that failed a requested check. Ifonthen the data checks will be returned in theqcresponse key for each variable within theOBSERVATIONSblock. (defaultoffifqcparameter omitted, elseonifqc=on)qc_checks([flag name], [flag source], keyword), defines a list of applied data checks. (defaults tosl_range_checkifqcparameter omitted, elsesynopticlabsifqc=on)“flag name” allows targeting one or more specific data checks in a comma separated list (e.g.
sl_range_check,sl_rate_check)“flag source” allows targeting one or more data check providers (
synopticlabs,mesowestormadis).“keyword” can be one of the following:
basic,advanced,all.allis equivalent toqc_checks=synopticlabs, and only applies the Synoptic basic+advanced QC suite.
Some examples of modifying the default QC checks are:
qc_checks=synopticlabs,ma_range_check, Applies the Synoptic QC suite (basic + advanced) and the MADIS range checkqc_checks=synopticlabs,madis, Applies the Synoptic and MADIS QC suites.
QC segments service
Nearly all users will rely on the /timeseries, /latest and /nearesttime API services to identify the values that fail relevant data checks. However, those services rely on code to access the archived data checks that are also available to users via the QC segment API service /qcsegments. For efficient storage and short access times, only the start and end times are stored for each period for which any values have failed a data check (referred to as a QC segment).
Data Checks Summary
Data Check | API name | Description |
|---|---|---|
| Identifies physically implausible values. For example, air temperature of 65°C (150°F) or -62°C (-80°F). | |
| Identifies if the absolute difference in two consecutive values is greater than the maximum plausible rate of change expected for the observed time interval. | |
| Identifies if a sequence of observations appear unchanging. For example, an air temperature sensor reporting the same value every 15 minutes for 24 hours. | |
| Flags both wind speed and gust if the wind speed is greater than the wind gust. | |
| Flags wind gust (and speed for some conditions) using the ratio of wind gust to wind speed. | |
| If wind speed (or gust) is flagged with the Range Check, then apply the Secondary Range Check flag to wind gust (or speed). | |
| If wind speed (or gust) is flagged with the Persistence Check, then apply the Secondary Persistence Check flag to wind gust (or speed). | |
| Flags soil moisture when soil temperature is < 0°C. | |
| Indicates bad sensor status, from provider-sourced status signal. | |
| Compares current snow depth observations against the median of multi-day snow depth history. | |
| Uses the percentile distribution from the station’s historical record to identify high outliers (air temperature only). | |
| Uses the percentile distribution from the station’s historical record to identify low outliers (air temperature only). | |
| Uses the percentile distribution from the station’s historical record to identify “interesting” values that are near or above the historical high value for that date and time (air temperature only). | |
| Uses the percentile distribution from the station’s historical record to identify “interesting” values that are near or below the historical low value for that date and time (air temperature only). | |
| Compares the current observation value to nearest-in-time values from neighboring stations within distance and elevation thresholds (air temperature, relative humidity, dew point temperature, wind speed, wind gust, pressure and altimeter). | |
| Spatial analysis check courtesy of the University of Utah MesoWest program. | |
| Persistence check to identify unchanging wind speed values, courtesy of the University of Utah MesoWest program. This check is redundant to the | |
| Spatial analysis check courtesy of the University of Utah Variational Surface Analysis (UU2DVAR). |
See a full list of our QC Checks
Data Check Descriptions
Technical descriptions of the Synoptic and MesoWest data checks.
Range check
Is the value physically plausible?
API Name: sl_range_check
Physically implausible values are identified using this check. Only if a value passes this check will the remaining QC checks be applied.
Variable | Unit | Minimum | Maximum |
|---|---|---|---|
Altimeter | Pascals | 85000 | 108000 |
Pressure | Pascals | 60000 | 108000 |
Temperature | Celsius | -59.44 | 57.22 |
Dew Point | Celsius | -59.44 | 35 |
Relative Humidity | % | 0.01 | 103 |
Wind Speed | m/s | 0 | 102.89 |
Wind Direction | Degrees | 0 | 360 |
Wind Gust | m/s | 0 | 102.89 |
Snow depth | Millimeters | 0 | 12700 |
Solar Radiation | W/m**2 | 0 | 1500 |
Soil Temperature | Celsius | -50 | 85 |
Precipitation accumulated | Millimeters | 0 | NULL |
Sea level pressure | Pascals | 85000 | 108000 |
Hours of sun | Hours | 0 | 24 |
Water Temperature | Celsius | -17.78 | 57.22 |
Weather conditions | code | 0 | 512000 |
Cloud layer 3 height/coverage | code | 0 | 8009 |
Low cloud symbol | code | 0 | 9 |
Mid cloud symbol | code | 10 | 19 |
High cloud symbol | code | 20 | 29 |
Pressure Tendency | code | 0 | 8999 |
Quality check flag | code | -1 | 9 |
Precipitation storm | Millimeters | 0 | 3810 |
Snowfall | Millimeters | 0 | 3810 |
Precipitation 1hr | Millimeters | 0 | 254 |
Precipitation 3hr | Millimeters | 0 | 762 |
Precipitation 5min | Millimeters | 0 | 25.4 |
Precipitation 10min | Millimeters | 0 | 50.8 |
Precipitation 15min | Millimeters | 0 | 76.2 |
Road sensor number | 1 | 10 | |
Road Temperature | Celsius | -40 | 65.56 |
Road Freezing Temperature | Celsius | -17.78 | 4.44 |
Road Surface Conditions | code | 1 | 100 |
unknown | 0 | 100 | |
Cloud layer 1 height/coverage | code | 0 | 18009 |
Cloud layer 2 height/coverage | code | 0 | 8009 |
Precipitation 6hr | Millimeters | 0 | 762 |
Precipitation 24hr | Millimeters | 0 | 1143 |
Visibility | Statute miles | -0.25 | 200 |
Remarks | text | NULL | NULL |
Raw observation | text | NULL | NULL |
6 Hr High Temperature | Celsius | -59.44 | 57.22 |
6 Hr Low Temperature | Celsius | -59.44 | 57.22 |
Peak Wind Speed | m/s | 0 | 102.89 |
Fuel Temperature | Celsius | -40 | 60 |
Fuel Moisture | gm | 0 | 100 |
Ceiling | Meters | 0 | 12192 |
Pressure change | code | 0 | 2000 |
Precipitation smoothed | Millimeters | 0 | 7620 |
IR Soil Temperature | Celsius | -59.44 | 57.22 |
Temperature in case | Celsius | -59.44 | 57.22 |
Soil Moisture | % | 0 | 100 |
Battery voltage | volts | 0 | 50 |
Data Insert Date/Time | minutes | 0 | 16000000 |
Data Update Date/Time | minutes | 0 | 16000000 |
Snow smoothed | Millimeters | 0 | 12700 |
Precipitation manual | Millimeters | 0 | 3810 |
Precipitation 1hr manual | Millimeters | 0 | 254 |
Precipitation 3hr manual | Millimeters | 0 | 762 |
Precipitation 5min manual | Millimeters | 0 | 25.4 |
Precipitation 10min manual | Millimeters | 0 | 50.8 |
Precipitation 15min manual | Millimeters | 0 | 76.2 |
Precipitation 6hr manual | Millimeters | 0 | 762 |
Precipitation 24hr manual | Millimeters | 0 | 1143 |
Snow manual | Millimeters | 0 | 12700 |
Snow interval | Millimeters | 0 | 3810 |
Road Subsurface Temperature | Celsius | -40 | 65.56 |
Water Temperature | Celsius | -17.78 | 57.22 |
Evapotranspiration | Millimeters | 0 | 127 |
Snow water equivalent | Millimeters | 0 | 2540 |
Precipitation 30 min | Millimeters | 0 | 127 |
All variables | NULL | NULL | |
Precipitable water vapor | Millimeters | 0 | 127 |
24 Hr High Temperature | Celsius | -59.44 | 57.22 |
24 Hr Low Temperature | Celsius | -59.44 | 57.22 |
Peak Wind Direction | Degrees | 0 | 360 |
Precipitation (weighing gauge) | Millimeters | 0 | 3810 |
Net Radiation | W/m**2 | -500 | 1000 |
1500 m Pressure | Pascals | 70000 | 100000 |
Wet bulb temperature | Celsius | -59.44 | 57.22 |
Soil Moisture tension | centibars | 0 | 300 |
Air Temperature at 2 meters | Celsius | -59.44 | 57.22 |
Air Temperature at 10 meters | Celsius | -59.44 | 57.22 |
Precipitation 1min | Millimeters | 0 | 12.7 |
18 Inch Soil Temperature | Celsius | -50 | 85 |
20 Inch Soil Temperature | Celsius | -50 | 85 |
18 Inch Soil Temperature2 | Celsius | -50 | 85 |
Pressure | Pascals | 60000 | 108000 |
Temperature | Celsius | -59.44 | 57.22 |
Relative Humidity | % | 0 | 100 |
Wind Speed | m/s | 0 | 102.89 |
Wind Direction | Degrees | 0 | 360 |
Wind Gust | m/s | 0 | 128.61 |
Latitude | Degrees | -90 | 90 |
Longitude | Degrees | -180 | 180 |
Elevation | Meters | -91.44 | 9144 |
Platform True Direction | Degrees | 0 | 360 |
Primary Swell Wave Direction | Degrees | 0 | 360 |
Primary Swell Wave Period | Seconds | 0 | 99 |
Primary Swell Wave Height | Meters | 0 | 10.25 |
Secondary Swell Wave Direction | Degrees | 0 | 360 |
Secondary Swell Wave Period | Seconds | 0 | 99 |
Secondary Swell Wave Height | Meters | 0 | 10.25 |
Tide Indicator | code | 0 | 10 |
Tide Departure | Meters | 0 | 30.48 |
Platform True Speed | m/s | 0 | 64.31 |
Wave Period | Seconds | 0 | 99 |
Wave Height | Meters | 0 | 33.63 |
Surface Temperature | Celsius | -50 | 85 |
Net Shortwave Radiation | W/m**2 | -500 | 1000 |
Net Longwave Radiation | W/m**2 | -500 | 1000 |
Sonic Temperature | Celsius | -59.44 | 57.22 |
Vertical Velocity | m/s | -2 | 2 |
Zonal Wind Standard Deviation | m/s | 0 | 5 |
Meridional Wind Standard Deviation | m/s | 0 | 5 |
Vertical Wind Standard Deviation | m/s | 0 | 5 |
Temperature Standard Deviation | Celsius | 0 | 5 |
Vertical Heat Flux | m/s C | -2 | 2 |
Friction Velocity | m/s | 0 | 5 |
SIGW/USTR | nondimensional | 0 | 5 |
Sonic Obs Total | nondimensional | 0 | 5000 |
Sonic Warnings | nondimensional | 0 | 5000 |
Moisture Standard Deviation | g/m**3 | 0 | 5 |
Vertical Moisture Flux | m/s g/m**3 | -1 | 1 |
Dew Point | Celsius | -59.44 | 57.22 |
Virtual Temperature | Celsius | -59.44 | 57.22 |
Geopotential Height | Meters | -300 | 30000 |
Sonic Wind Speed | m/s | 0 | 102.89 |
Sonic Wind Direction | Degrees | 0 | 360 |
Outgoing Shortwave Radiation | W/m**2 | 0 | 1000 |
Clear Sky Solar Radiation | W/m**2 | 0 | 1500 |
Estimated Snowfall Rate | Millimeters | 0 | NULL |
Grip 1 Ice Friction Code | 0 | 1 | |
Grip 2 Level of Grip | 0 | 1 | |
Soil Temperature 2 | Celsius | -50 | 85 |
Soil Moisture 2 | % | 0 | 100 |
Soil Temperature 3 | Celsius | -50 | 85 |
Soil Temperature 4 | Celsius | -50 | 85 |
Photosynthetically Active Radiation | umol/m**2 s | 0 | 2500 |
PM 2.5 Concentration | ug/m3 | 0 | 1000000 |
Flow Rate | liters/min | -1000 | 10000 |
Internal Relative Humidity | % | 0 | 100 |
Air Flow Temperature | Celsius | -59.44 | 57.22 |
Ozone Concentration | ppb | 0 | 500 |
Precipitation since 00 UTC | Millimeters | 0 | 1143 |
Stream flow | ft3/s | 0 | 15000000 |
Gauge height | ft | NULL | NULL |
Black Carbon Concentration | ug/m3 | 0 | 200 |
Precipitation since local midnight | Millimeters | 0 | 1143 |
Particulate Concentration | ug/m3 | 0 | 10000 |
Filter Percentage | % | 0 | 100 |
Sensor Error Code | code | 0 | 1000 |
Electric Conductivity | dS/m | 0 | 10 |
Permittivity | 0 | 100 | |
Precipitation since 7 AM local | Millimeters | 0 | 1219.2 |
Snow 24hr | Millimeters | 0 | 12700 |
Snow since 7 AM local | Millimeters | 0 | 12700 |
Past weather | code | 0 | 9 |
Precipitation 12hr | Millimeters | 0 | 609.6 |
METAR Origin | code | 0 | 1 |
Surface Level | Millimeters | -2540 | 2540 |
Incoming Longwave Radiation | W/m**2 | 0 | 1500 |
Outgoing Longwave Radiation | W/m**2 | 0 | 1500 |
Derived Aerosol Boundary Layer Depth | Meters | 0 | 12192 |
Precipitation Rate | Millimeters/hr | 0 | 10 |
Carbon Monoxide Concentration | ppm | -10 | 1000000 |
Ammonia Concentration | ppb | -10 | 1000000 |
NOx-Computed Nitrogen Dioxide Concentration | ppb | -10 | 1000000 |
NOy-Computed Nitrogen Dioxide Concentration | ppb | -10 | 1000000 |
Nitric Oxide Concentration | ppb | -10 | 1000000 |
Nitrogen Oxides Concentration | ppb | -10 | 1000000 |
Total Reactive Nitrogen Concentration | ppb | -10 | 1000000 |
PM 10 Concentration | ug/m3 | 0 | 1000000 |
Sulfur Dioxide Concentration | ppb | -10 | 1000000 |
370nm Aethelometer Channel | ug/m3 | -10 | 1000000 |
Precipitation Interval | Millimeters | 0 | NULL |
Snow Core Water Equivalent | Millimeters | 0 | NULL |
Fosberg Fire Weather Index | 0 | 100 | |
Visibility Code | NULL | NULL | |
Incoming UV Radiation | W/m**2 | 0 | 500 |
Outgoing UV Radiation | W/m**2 | 0 | 500 |
Water Current Speed | m/s | 0 | 5.14 |
Water Current Direction | Degrees | 0 | 360 |
Mean Tide Level | Meters | -20 | 20 |
Mean Sea Level | Meters | -20 | 20 |
Mean Lower Low Water | Meters | -20 | 20 |
Mean Low Water | Meters | -20 | 20 |
Mean High Water | Meters | -20 | 20 |
Mean Higher High Water | Meters | -20 | 20 |
Columbia River Datum | Meters | -20 | 20 |
International Great Lakes Datum | Meters | -20 | 20 |
Great Lakes Low Water Datum | Meters | -20 | 20 |
North American Vertical Datum | Meters | -20 | 20 |
Station Datum | Meters | -20 | 20 |
Raw SYNOP Message | text | NULL | NULL |
Total Solar Radiation | MJ/m**2 | NULL | NULL |
Wet Bulb Globe Temperature | Celsius | -59.44 | 65.56 |
Electric Field Alarm Rate | NULL | NULL | |
Lightning Strike Count | NULL | NULL | |
Freezing Rain Status Signal | code | NULL | NULL |
Freezing Rain Ice Signal | code | NULL | NULL |
Wind Gust Time | epoch | NULL | NULL |
SYNOP Weather Condition | code | NULL | NULL |
Wind Chill | Celsius | -113.8 | 9.8 |
Heat Index | Celsius | 25.4 | 310.4 |
Tide Water Level | Meters | NULL | NULL |
Water Electrical Conductivity | mS/cm | NULL | NULL |
Water Salinity | psu | NULL | NULL |
Water Oxygen Saturation | % | 0 | 100 |
Water Dissolved Oxygen | ppm | NULL | NULL |
Water Chlorophyll Concentration | ug/l | NULL | NULL |
Water Turbidity | FTU | NULL | NULL |
Water pH | NULL | NULL | |
Water Eh | millivolts | NULL | NULL |
Water Column Height | Meters | NULL | NULL |
Dominant Wave Period | Seconds | NULL | NULL |
Mean Wave Direction | Degrees | NULL | NULL |
Low Cloud Type | code | 0 | 20 |
Mid Cloud Type | code | 0 | 20 |
High Cloud Type | code | 0 | 20 |
Total Cloud Coverage | Oktas | 0 | 8 |
Low Cloud Coverage | Oktas | 0 | 8 |
Mid Cloud Coverage | Oktas | 0 | 8 |
High Cloud Coverage | Oktas | 0 | 8 |
Minutes of Sunshine | Minutes | 0 | 60 |
Diffuse Radiation | W/m**2 | 0 | 1200 |
Cloud Drift Direction Low | Degrees | 0 | 360 |
Cloud Drift Direction Mid | Degrees | 0 | 360 |
Cloud Drift Direction High | Degrees | 0 | 360 |
Change in Pressure | Pascals | -1000000 | 1000000 |
Water Level | Meters | -20 | 20 |
Groundwater Level | Meters | -20 | 50 |
Fluorescent Dissolved Organic Matter | RFU | 0 | 200 |
Blue-Green Algae | RFU | 0 | 100 |
Water Ammonium Concentration | mg/L | 0 | 5 |
Water Nitrate Concentration | mg/L | 0 | 50 |
Maximum wave height | m | 0 | 40 |
Oxidation reduction potential | mV | -600 | 600 |
UV Index | Index | 0 | 15 |
Air Quality Index Raw | NULL | NULL | |
Air Quality Index US | Index | 0 | 500 |
Air Quality Index EU | Index | 0 | 6 |
Grass Minimum Temperature | Celsius | -59.44 | 57.22 |
Leaf Wetness | NULL | NULL | NULL |
CFFDRS Fine Fuel Moisture Code | code | 0 | 101 |
CFFDRS Drought Code | code | 0 | 1500 |
CFFDRS Duff Moisture Code | code | 0 | 300 |
CFFDRS Fire Weather Index | Index | 0 | 100 |
CFFDRS Initial Spread Index | Index | 0 | 50 |
CFFDRS Drought Severity Rating | Index | 0 | 6 |
CFFDRS Build Up Index | Index | 0 | 200 |
Fire Danger Code Category | text | NULL | NULL |
Fire Danger Code Numeric | code | 1 | 5 |
Rate of change check
Is the change between two consecutive values unrealistic?
API Name: sl_rate_check
The rate change check compares the absolute difference between two consecutive observations to the maximum plausible rate of change expected within the time interval.
Variable name | Unit | Rules |
|---|---|---|
Pressure Altimeter | Pascals | 5 min: 925 |
Temperature | Celsius | 1-3 min: 3 |
Persistence check
Do the values appear to be unchanging?
sl_pers_check
For parameters for which it is appropriate to do so, the persistence check compares the range of values (difference between the maximum and minimum) within a specified time period relative to the minimum plausible range expected for that parameter.
The following table lists the variable, time period evaluated, and the minimum plausible range expected for that variable..
Variable name | Unit | Evaluation period | Min number of obs | Required change |
|---|---|---|---|---|
Altimeter | Pascals | 24 hrs | 24 | 5.0 |
Pressure | Pascals | 24 hrs | 24 | 5.0 |
Temperature | Celsius | 24 hrs | 24 | 0.1 |
Dew Point | Celsius | 24 hrs | 24 | 0.1 |
Relative Humidity | % | 24 hrs | 24 | 0.5 |
Wind Speed | m/s | 24 hrs | 24 | 0.25 |
Wind Direction | Degrees | 24 hrs | 24 | 2.5 |
Wind Gust | m/s | 24 hrs | 24 | 0.25 |
Solar Radiation | W/m**2 | 48 hrs | 48 | 0.5 |
Soil Temperature | Celsius | 48 hrs | 48 | 0.05 |
Sea_level pressure | Pascals | 24 hrs | 24 | 5.0 |
Water Temperature | Celsius | 48 hrs | 48 | 0.05 |
Road Temperature | Celsius | 24 hrs | 24 | 0.1 |
Sonic_Wind Direction | Degrees | 24 hrs | 24 | 1.0 |
Peak_Wind Speed | m/s | 24 hrs | 24 | 0.25 |
Fuel Temperature | Celsius | 72 hrs | 72 | 0.1 |
Fuel Moisture | gm | 24 hrs | 24 | 0.1 |
Sonic_Wind Speed | m/s | 24 hrs | 24 | 0.1 |
IR_Soil Temperature | Celsius | 24 hrs | 24 | 0.1 |
Road Subsurface Temperature | Celsius | 48 hrs | 48 | 0.05 |
Water Temperature | Celsius | 48 hrs | 48 | 0.05 |
Peak_Wind Direction | Degrees | 24 hrs | 24 | 2.5 |
Net Radiation | W/m**2 | 48 hrs | 48 | 0.5 |
Air_Temperature at_2_meters | Celsius | 24 hrs | 24 | 0.1 |
Air_Temperature at_10_meters | Celsius | 24 hrs | 24 | 0.1 |
Pressure | Pascals | 24 hrs | 24 | 5.0 |
Temperature | Celsius | 24 hrs | 24 | 0.1 |
Relative Humidity | % | 24 hrs | 24 | 0.5 |
Wind Speed | m/s | 24 hrs | 24 | 0.25 |
Wind Direction | Degrees | 24 hrs | 24 | 2.5 |
Wind Gust | m/s | 24 hrs | 24 | 2.5 |
Surface Temperature | Celsius | 24 hrs | 24 | 0.1 |
Net Shortwave Radiation | W/m**2 | 48 hrs | 48 | 0.5 |
Net Longwave Radiation | W/m**2 | 48 hrs | 48 | 0.5 |
Sonic Temperature | Celsius | 24 hrs | 24 | 0.1 |
Dew Point | Celsius | 24 hrs | 24 | 0.1 |
Virtual Temperature | Celsius | 24 hrs | 24 | 0.1 |
Outgoing Shortwave Radiation | W/m**2 | 48 hrs | 48 | 0.5 |
Photosynthetically Active Radiation | umol/m**2 s | 48 hrs | 48 | 0.5 |
PM_2.5 Concentration | ug/m3 | 24 hrs | 24 | 0.5 |
Ozone Concentration | ppb | 24 hrs | 24 | 0.5 |
Black Carbon Concentration | ug/m3 | 24 hrs | 24 | 0.5 |
Particulate Concentration | ug/m3 | 24 hrs | 24 | 0.5 |
Wind speed vs. maximum gust check
Is the wind speed value greater than the wind gust value?
API Name: sl_windspd_maxgust_check
If the reported wind speed is greater than the wind gust, both the wind speed and gust values are flagged. Note: the conventions for reporting wind speed and gust differ among data providers. The wind gust reported may be a maximum wind speed within the time interval for that observation.
Wind gust factor check
Is the ratio of wind gust to wind speed unrealistic?
API Name: sl_wind_gust_factor_check
If the ratio of wind gust to wind speed exceeds a threshold value, wind gust is flagged. If wind gust and wind speed are the same (ratio of 1), or if wind speed is zero with a non-zero gust, both wind speed and gust are flagged. Wind gusts must exceed 31.3 m/s (70 mph) to be considered by this check. The outlier threshold is defined with a power-law curve, derived from large data samples of wind speed and gust.
Secondary range check
API Name: sl_secondary_range_check
This check is used to “cross-flag” between wind speed and wind gust, as these variables are usually reported from the same sensor. If wind speed (or gust) is out-of-range, then apply the secondary range check to wind gust (or speed).
Secondary persistence check
API Name: sl_secondary_pers_check
This check is used to “cross-flag” between wind speed and wind gust, as these variables are usually reported from the same sensor. If wind speed (or gust) is persisting, then apply the secondary persistence check to wind gust (or speed).
Soil moisture freezing check
API Name: sl_soil_moisture_freezing_check
Flag soil moisture when soil temp is < 0°C.
Sensor status signal check
API Name: sl_sensor_status_signal_check
Indicates bad sensor status, from provider-sourced status signal. Synoptic can ingest sensor health status signal as a variable, and then use this to flag the corresponding data from the sensor.
Snow Depth History Check
Is the current snow depth observation an outlier compared to the median of the multi-day snow depth history?
API Name: sl_snow_depth_hist_check
Compares the current snow depth observation against a median of multi-day history (e.g. 3 days). Outliers are flagged that can commonly result from sonic snow depth sensors.
Percentile high outlier check
Is the value a high outlier compared to the percentile distribution of the station’s historical record?
API Name: sl_percentile_hioutlier_check
This flag is applied to air temperature values if:
value > (99.5th percentile + 10°C)
Synoptic Data completes yearly re-analysis of the historical record of air temperature data for every station in our database. A series of outlier identification algorithms are run to identify and remove obvious outliers in the historical record. Using this “cleaned” record, we then leverage the percentile distribution of the data to compare to current observations. To be used in this check, a station must have at least 3 years of continuous air temperature data. This check is intended to identify values that are very likely to be erroneous (significantly beyond any historically high or low temperatures) for the date and hour of the observation. We use extreme air temperature events to calibrate the threshold, with the intention that flagged data is likely unrealistic and can be removed from an API request.
Percentile low outlier check
Is the value a low outlier compared to the percentile distribution of the station’s historical record?
API Name: sl_percentile_looutlier_check
This flag is applied to air temperature values if:
value < (0.5th percentile - 15°C)
See technical details for the percentile outlier checks as described above for the percentile high outlier check.
Percentile high flag check
Is the value near or above historical high values compared to the percentile distribution of the station’s historical record?
API Name: sl_percentile_hiflag_check
This flag is applied to air temperature values if:
99.5th percentile < value < (99.5th percentile + 10°C)
The percentile high flag is intended to indicate air temperature data that may be near or above historical maximum temperatures for the date and hour of the observation. These flags should not be used to remove data from an API request, but instead may be used to indicate “interesting” or historically significant observations. This check is not included in the synopticlabs test suite.
Percentile low flag check
Is the value near or below historical low values compared to the percentile distribution of the station’s historical record?
API Name: sl_percentile_loflag_check
This flag is applied to air temperature values if:
(0.5th percentile - 15°C) < value < 0.5th percentile
The percentile low flag is intended to indicate air temperature data that may be near or below historical minimum temperatures for the date and hour of the observation. These flags should not be used to remove data from an API request, but instead may be used to indicate “interesting” or historically significant observations. This check is not included in the synopticlabs test suite.
Spatial value check
Is the value significantly different than neighboring observations?
API Name: sl_spatial_value_check
This flag is applied to multiple variables according to thresholds defined in the following table. Value thresholds indicate the threshold for flagging the current value, as: abs(value - median( neighbor values) >= threshold. Neighbor thresholds indicate the threshold for agreement between neighbor values, as: (max(neighbor values) - min(neighbor values)) <= threshold. Thresholds are not provided for pressure or relative humidity, as these variables are flagged via derived altimeter and derived dew point temperature, respectively.
Variable | Unit | Value threshold | Neighbors threshold |
|---|---|---|---|
Altimeter | Pascals | 3000 | 3000 |
Pressure | Pascals | (flagged by altimeter) | – |
Air Temperature | Celsius | 10 | 15 |
Dew Point Temperature | Celsius | 15 | 15 |
Relative Humidity | % | (flagged by dew point) | – |
Wind Speed | m/s | 20 | 15 |
Wind Gust | m/s | 40 | 20 |
To run this check there must be at least two neighboring stations that meet the following requirements:
Within 30 km distance and 200 meters elevation
Closest-in-time values are within -1.5 hrs and +0.5 hrs of the current value
Cannot have any open QC flags
Linear regression check
API Name: mw_multvariate_lin_reg_check
A multivariate linear regression check courtesy of the University of Utah MesoWest program. This check identifies air temperature, moisture, and pressure observations that appear to be significantly different than surrounding observations. More information on this check can be obtained here.
24-hr wind persistence check
API Name: mw_24h_wind_persistence_check
Persistence check to identify unchanging wind speed values, courtesy of the University of Utah MesoWest program. This check is redundant to the sl_pers_check.
UU2DVAR rejection check
API Name: mw_uu2dvar_rejection
A spatial comparison check with surrounding observations and gridded surface meteorological fields courtesy of the University of Utah Variational Surface Analysis (UU2DVAR). Observations that have been flagged by this check indicate they were statistically rejected from the UU2DVAR algorithm. For more information on UU2DVAR, please consult this publication.