
Statistics and Percentiles Services Explained
Across sectors such as fire weather, emergency management, renewable energy, and agriculture, decision-makers rely heavily on weather data. While real-time readings are crucial, they are often not enough. Risk assessment of gusty conditions during fire season by utilities and emergency managers depends on how anomalous conditions are relative to the past. Overnight air temperatures remaining stubbornly high compared to historical norms have important implications for spikes in energy demand that must be considered by utility managers.
The addition of historical context amplifies the value of real time data, but generally requires that users manually analyze historical records, or leverage gridded data products with temporal and spatial limitations that can make direct comparison against local station observations challenging.
Synoptic’s Statistics and Percentiles Services address this gap by offering statistical context to the real time station data, built on the station’s data archive, and made available alongside Synoptic’s other real time API feeds. It provides actionable context by facilitating the rapid comparison of current observations to recent statistical extremes and historical norms and distributions, allowing users to quickly evaluate how unusual or expected the current conditions are.
Statistics Service
Synoptic’s Statistics Service provides programmatic access to common statistics for nearly any variable that reports a numeric output (see below) across the >150,000 actively reporting stations aggregated by Synoptic. Features of the Statistics Service include:
Request of basic summary statistics (minimum, maximum, and mean values), observation counts, and timestamps of requested statistical extreme reports.
Statistics are available at daily or monthly intervals.
Daily and monthly statistics are available in both UTC and station-local times.
Select one to many stations with the same flexibility that is supported by Synoptic’s other Weather API services.
Performant service supports statistics queries for a station’s entire period of record with minimal latency.
Example use case
Compare current conditions to past historical events
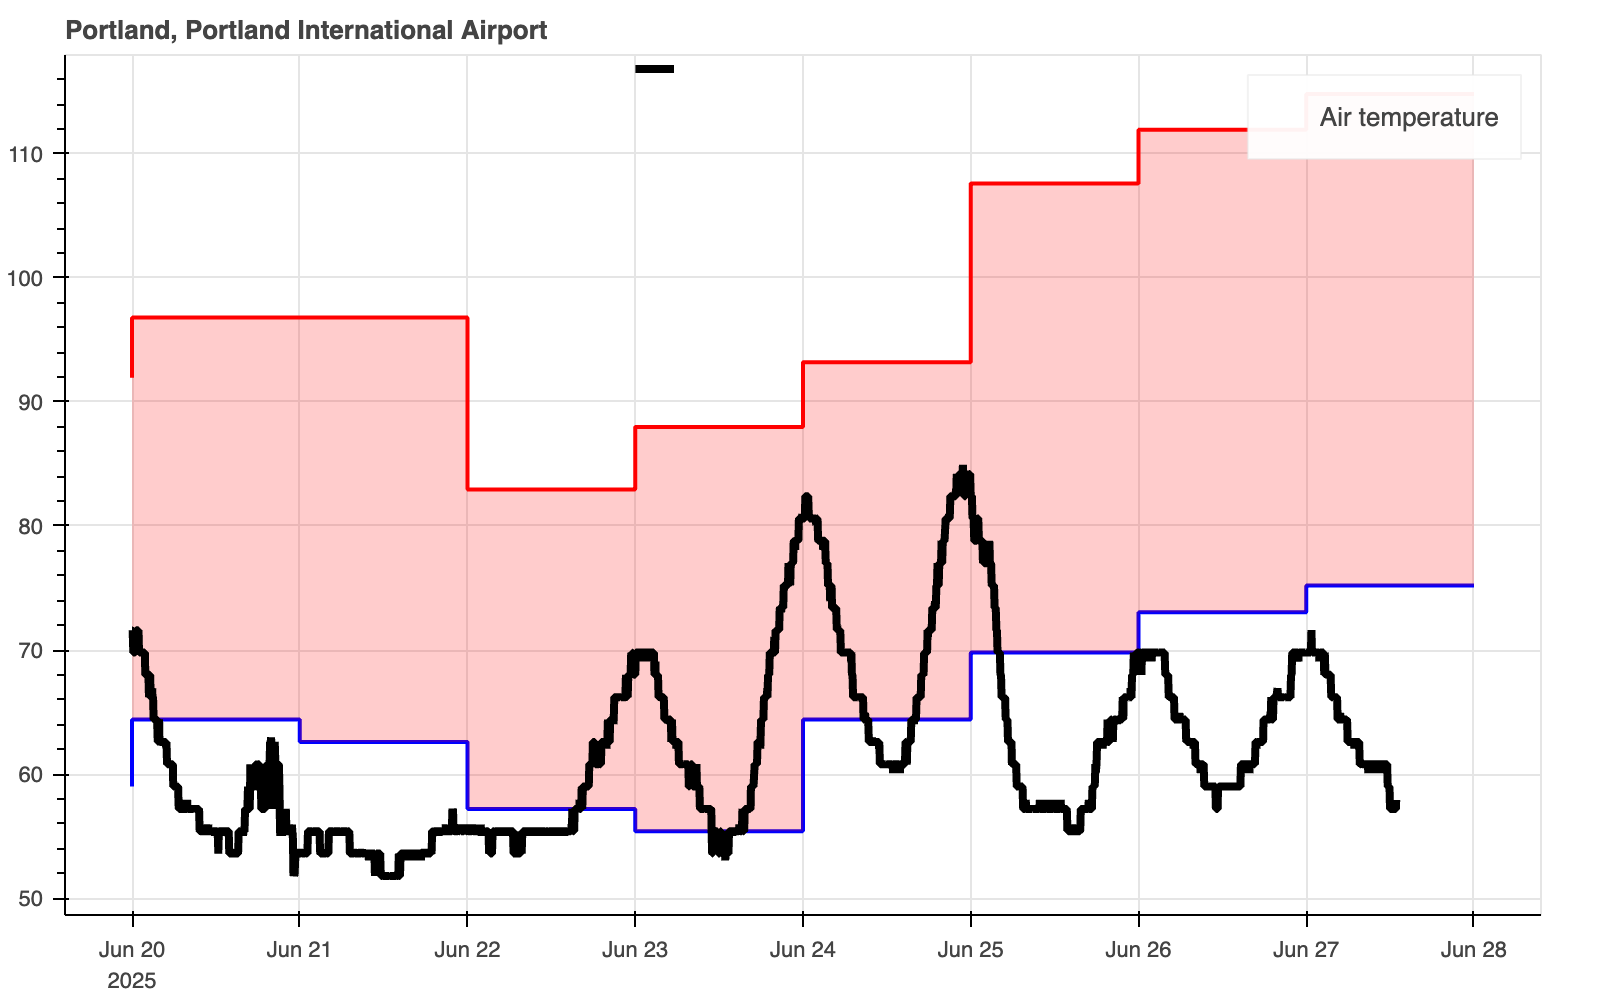
Air temperature in Portland, OR during the June 20-28, 2025 period compared to the minimum and maximum values for the same period during the 2021 Pacific Northwest heat dome event (shaded).
Percentiles Service
Synoptic’s Percentiles Service gives users access to historical context that is specific to their targeted station and variable of interest. Percentile distributions are computed from the growing station data archive hosted by Synoptic, using reports which have passed our own quality control standards (see more below). Key features of the Percentiles Service include:
Distribution percentiles (e.g., 5th, 50th, 95th) for:
Air temperature
Wind gust
Wind speed
Users can request percentiles based on:
the entire station data archive
the archive of daily maximum or minimum values
the archive of values centered on a short window around a requested hour of the year to gain insights into conditions with diurnal to seasonal variability (air temperature only). See below for more information.
Percentiles distributions update at a monthly cadence to ensure data includes recent conditions and trends.
Integration with the Weather API’s Latest service to return the placement of latest reports within the station’s percentile distribution.
Select one-many stations with the same flexibility that is supported by Synoptic’s other Weather API services.
Example use cases
Add important historical context during critical fire conditions
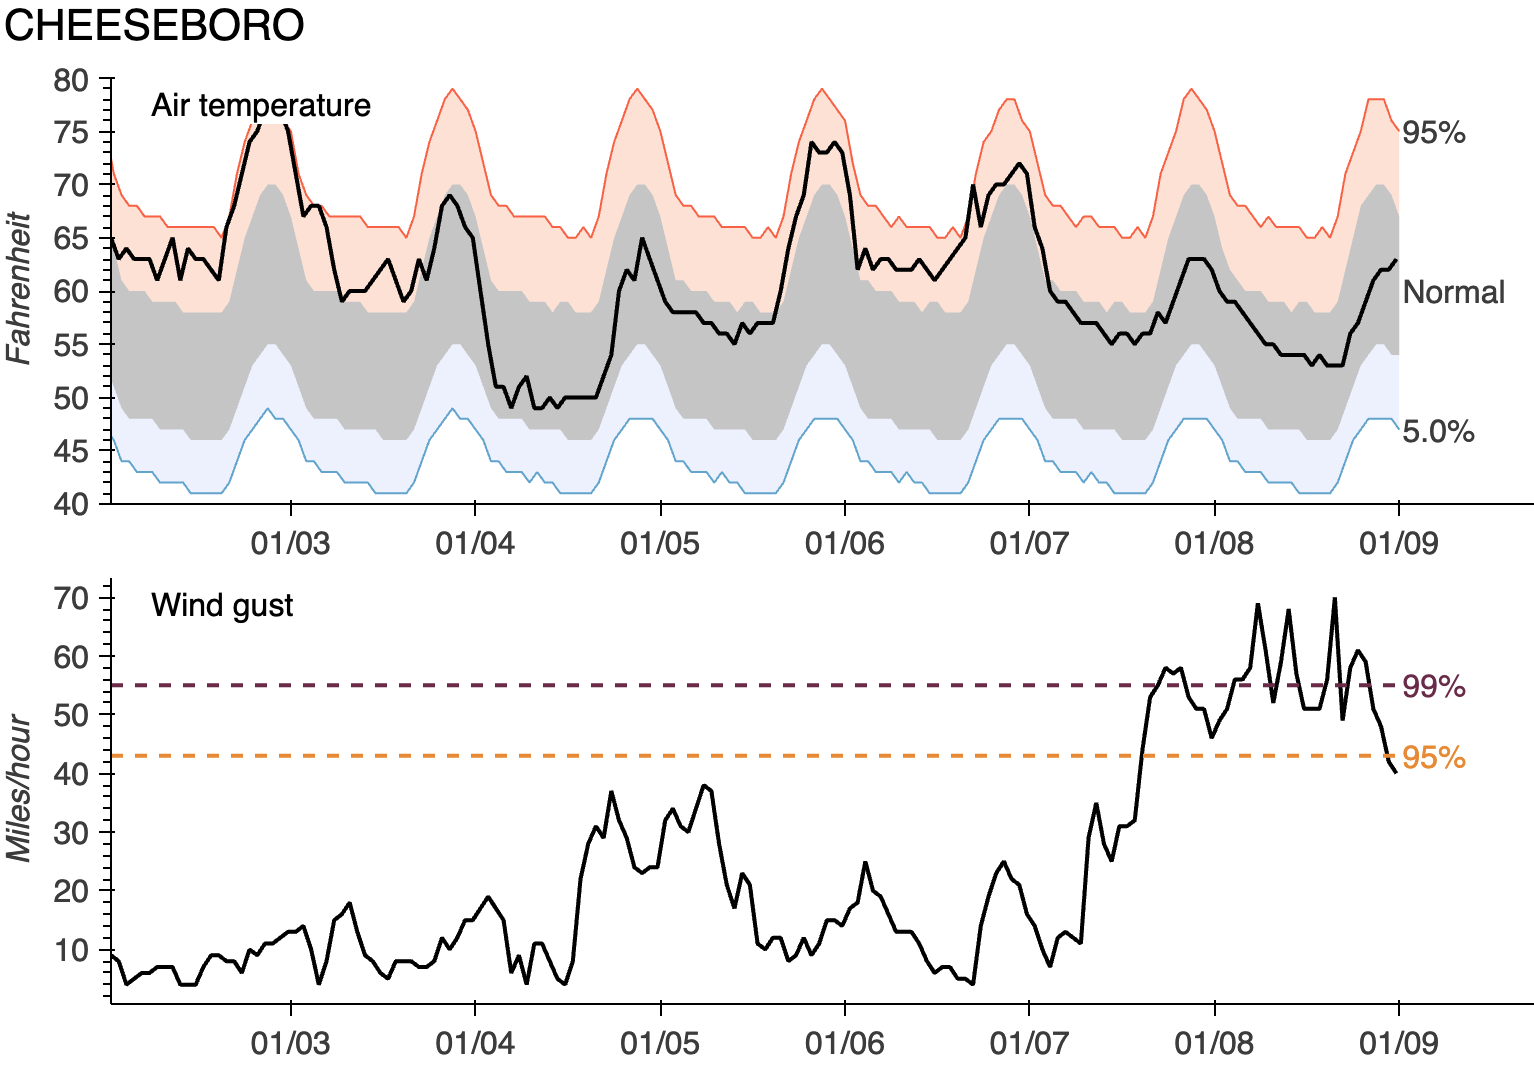
Figure 1: Air temperature and wind gust percentile thresholds give important context to conditions and show gusts exceeding the 99th% during the Los Angeles fires in January, 2025.
Place recent air temperature conditions within the normal reported range for the time of year.
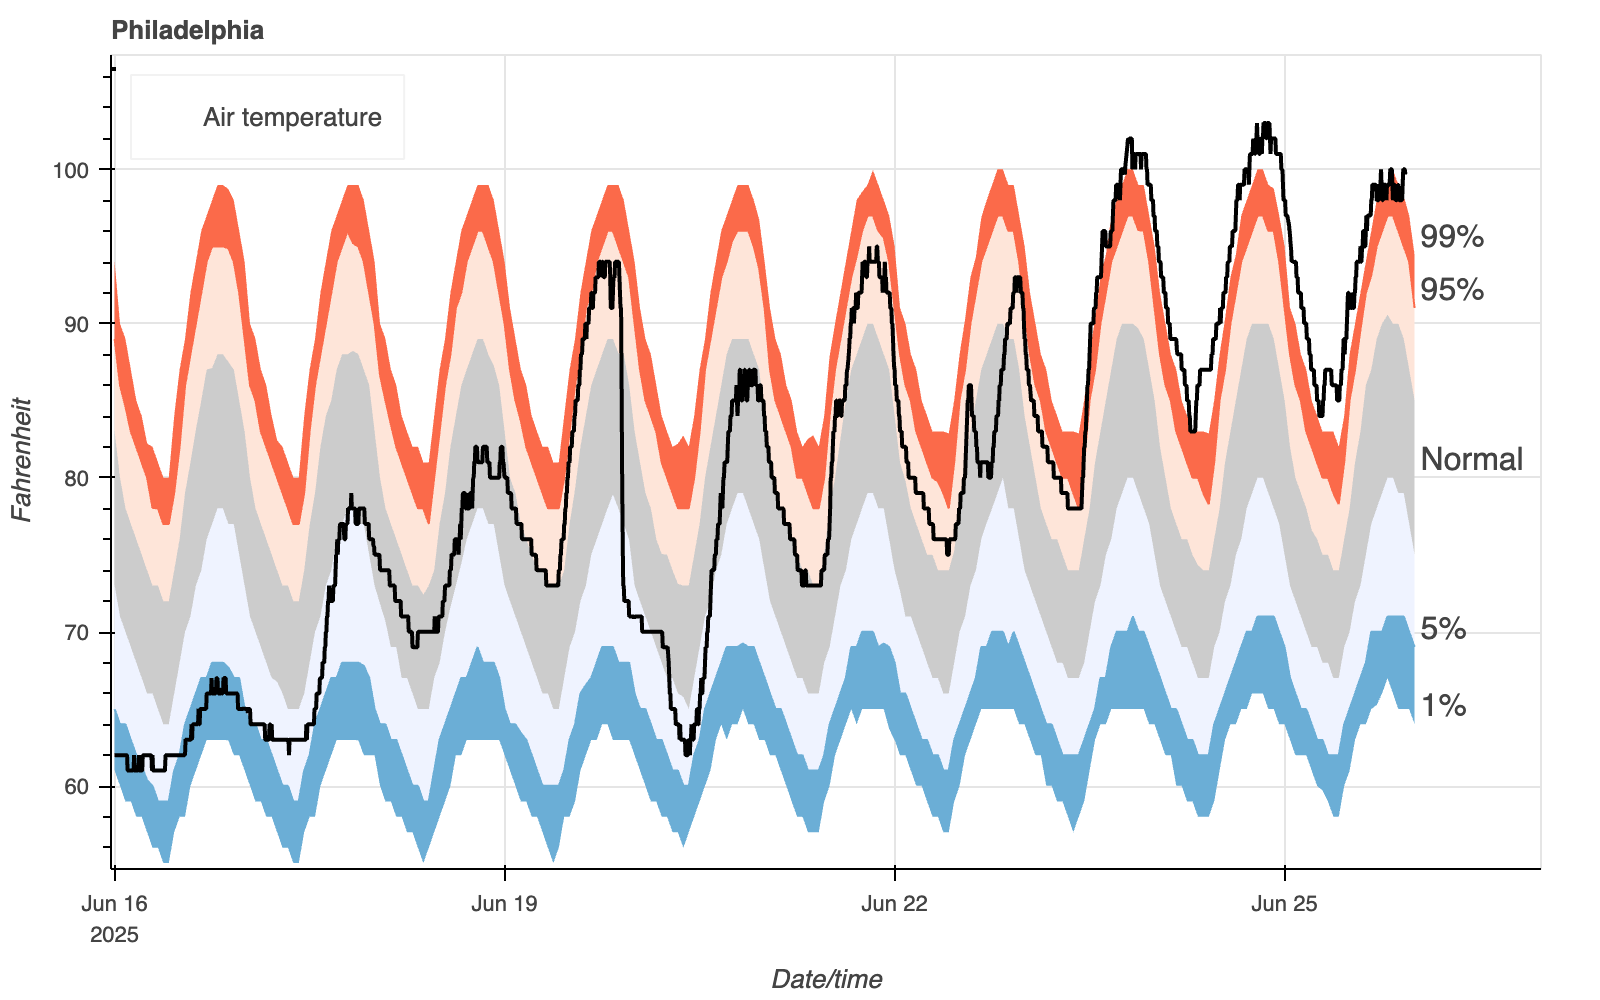
Figure 2: Unseasonably cool temperatures in mid June, 2025 give way to anomalous heat in Philadelphia, PA.
Dissemination
The statistics and percentiles products are integrated as new services in our Weather API. Doing so offers the same superior features supported by Synoptic’s other Weather API services, including:
flexibility in selecting one to many stations using a range of query parameters based on geographic location and web application considerations
Easy integration with existing data requests from other Weather API services
High performance, stability, and minimal latency
For more information, check out our Weather API documentation.
Technical Details
Quality Control
Synoptic Data performs quality control in real time on all data flowing through its system, and maintains a quality control archive alongside the raw observations. These quality control checks are relied upon as a set of standards to filter observations used in the calculation of statistics and percentiles. Only observations passing Synoptic’s range, rate of change, temporal persistence, wind speed vs wind gust internal consistency checks, and spatial buddy checks are used in generation of these derived products. More information on Synoptic’s quality control checks can be found in our documentation.
Synoptic’s real time and archived data records are considered a provisional dataset. While our quality control procedures are intended to identify implausible or unrealistic data, suspicious data records may still pass existing quality control checks and be incorporated into derivative products. Continuous improvement of quality control is a high priority for Synoptic in order to increase the value of the datasets we aggregate. As new quality control procedures are implemented, improvements are replayed over the complete historical data archive to iteratively improve the dataset underlying statistics and percentiles calculations.
Percentiles Service
Monthly updating of the percentiles database is performed to ensure that percentile distributions are up to date with current and recent conditions; monthly updating has limited influence on stations with a long period of record, but may be influential for stations with shorter records. Percentile distributions are determined for any station with a period of record exceeding one year. Only quality controlled, raw data is used in the calculation of percentiles. Gap filling is not employed. In addition to a minimum period of record, stations must meet minimum requirements for data completeness in order to be processed.
Percentiles calculated over a station’s complete period of record take into account all station observations. The dataset is not normalized to a common time interval (e.g. hourly). Stations aggregated by Synoptic can report across a range of time intervals, from 1 minute to daily. This may influence interpretation of results when compared across stations with different reporting intervals. Note that this is not a consideration when calculating percentiles from daily maximum or minimum statistics.
Hourly air temperature percentiles are computed by selecting station reports closest to the hour in consecutive days over a +/- 15 day window centered on the hour in question for every year in the station’s period of record (e.g. Figure 3). This data selection is performed in order to establish a suitably large sample size to calculate a percentile distribution, while still targeting a time period that is representative of the seasonal-diurnal conditions of the hour in question.
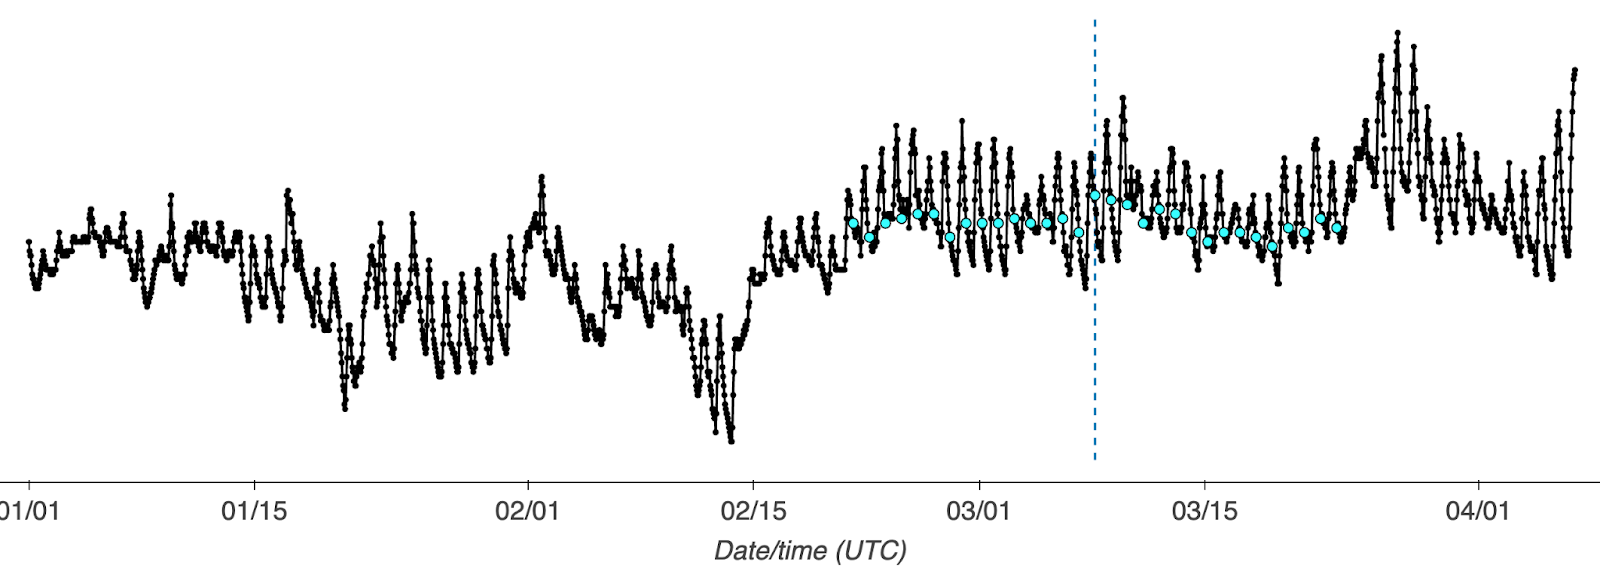
Figure 3: Conceptual demonstration of data points (cyan) used to calculate the hourly percentile distribution at March 7, 0000Z (vertical dashed line).
Statistics Service supported variables
Met variables
Air temperature
Altimeter
Ceiling
Dew point temperature
Fuel moisture
Fuel temperature
Heat index
Peak wind speed
Pressure
Relative humidity
Road subsurface temperature
Road temperature
Sea level pressure
Solar radiation
Visibility
Wet bulb temperature
Wet bulb globe temperature
Wind chill
Wind speed
Wind gust
Air quality
CO concentration
PM 10 concentration
PM 2.5 concentration
Ozone concentration
SO2 concentration
Hydro
Evapotranspiration
Gage height
Soil moisture
Soil temperature
Stream flow
Water level
Water temperature
Wave period
Wave height