
Data Availability Dashboard
The Data Availability Dashboard provides users with the information they need to determine if data is flowing through Synoptic’s system at the network- and station-levels, and how the current data flow fits in the context of the recent past. It is not meant to be a subjective assessment of network or station quality.
In order to achieve this, we provide objective summary counts of the number of stations reporting on a network-by-network basis, and the number of observation reports transmitted by single stations to Synoptic. We also provide indications of the time delays introduced along the path from data measurement to transmission to Synoptic’s system where it is made available to you, the user. As described in our ‘Note about the data’, the measurement and transmission frequencies are highly variable among networks and stations, depending on a number of external factors.
Below is a detailed explanation of the data availability dashboard components, and a brief note regarding the nature of the data we aggregate. If you have any questions or would like to provide feedback please reach out to us at support@synopticdata.com.
Dashboard terminology
Network-level metrics
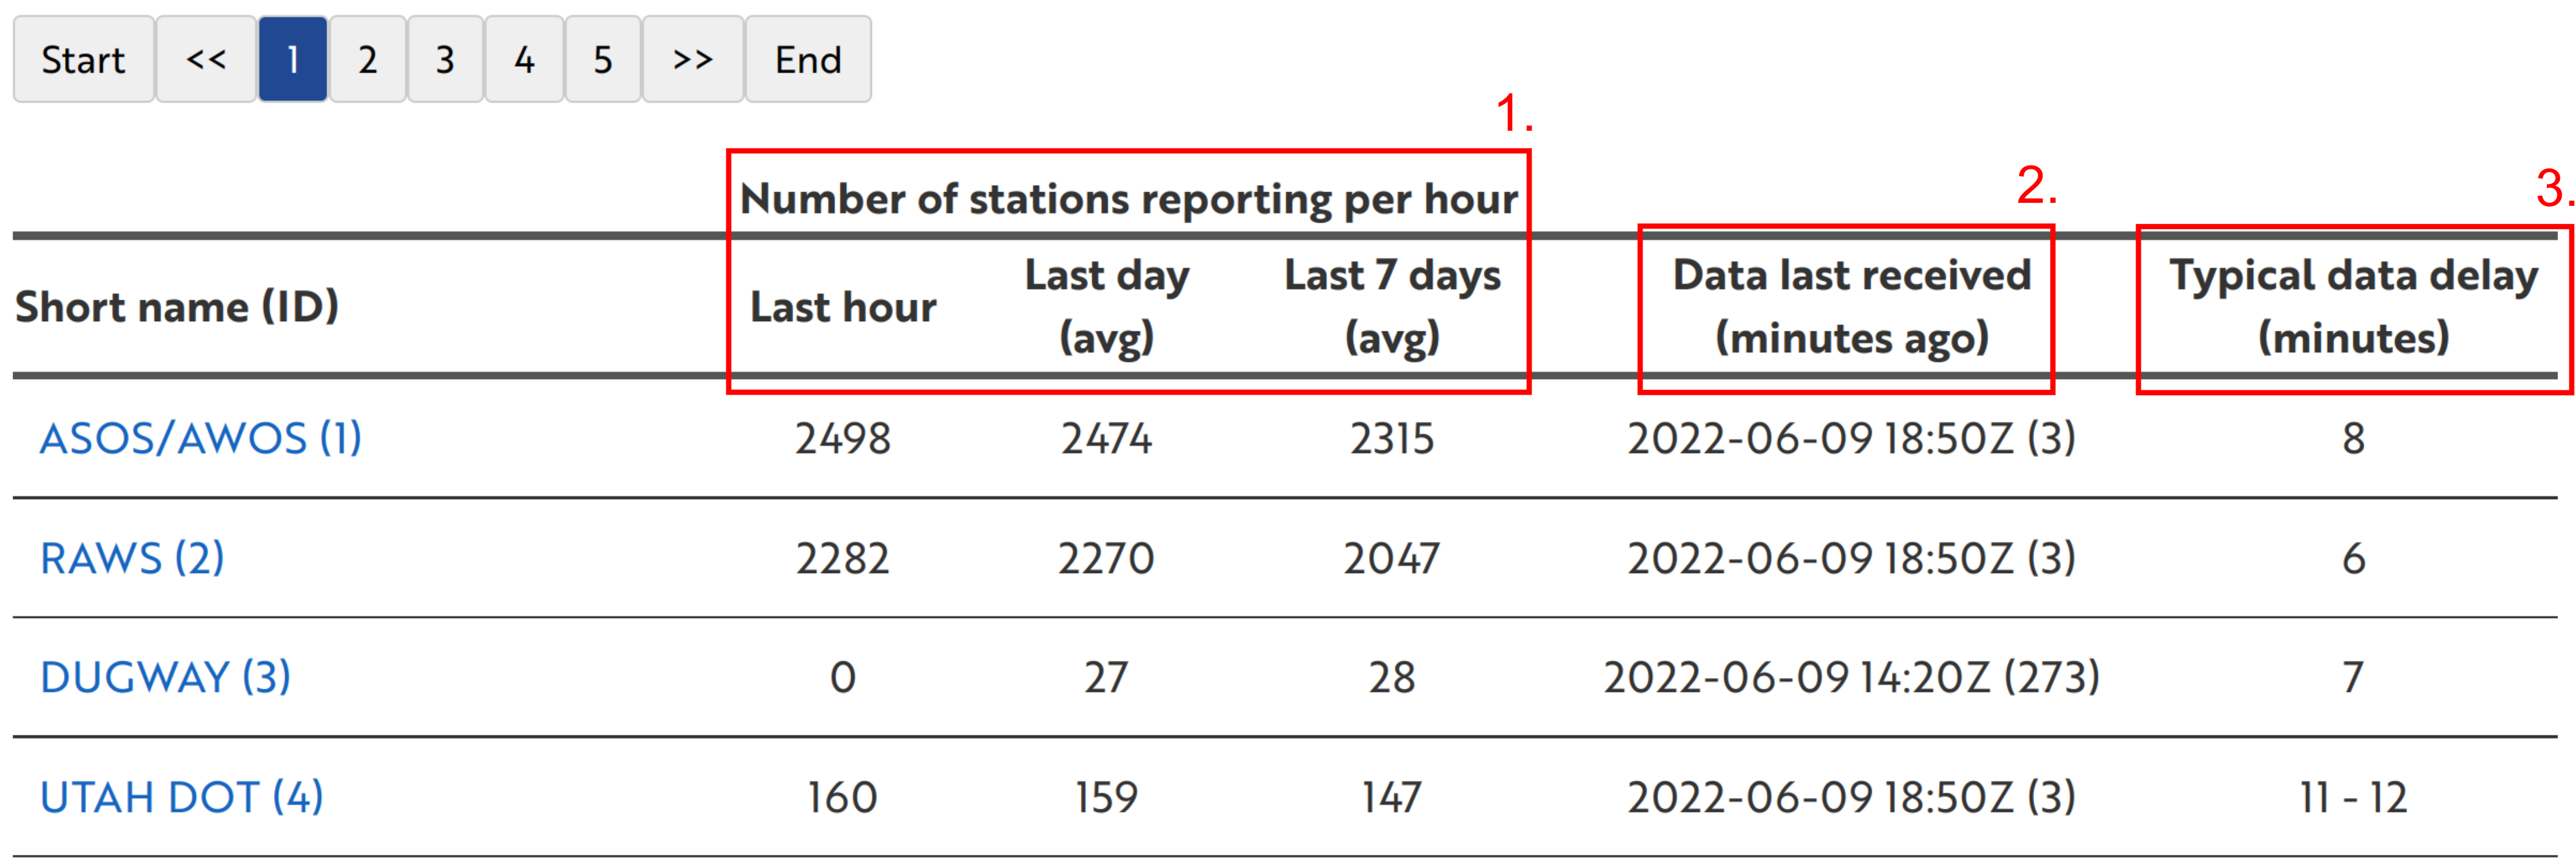
1. Number of stations reporting
Number of stations reporting is the number of unique stations reporting for a network in a one hour period. These hourly unique station counts are provided for the most recent hour, as an average over the past 24 hours, and over the past 7 days.
2. Data last received
The time (to the nearest 5 minute increment) of the most recent transmission of data from the given network to Synoptic. This is the approximate time when the network data was most recently made available in the Synoptic system and is not synonymous with the timestamp of the most recent measurement.
The time elapsed since the last data transmission is also displayed in parentheses in minutes.
3. Typical data delay
The data delay is the time between when an observation is logged and when it is transmitted to Synoptic and available for use in our system. It is the sum of both the time since the last data transmission and the time between when a measurement was made and when it was transmitted to Synoptic.
At the network-level, this delay is computed hourly as the average delay across all reports by all stations in the network. We define the ‘typical’ data delay as the interquartile range of these hourly values over the last day (24 hours).
Station-level metrics
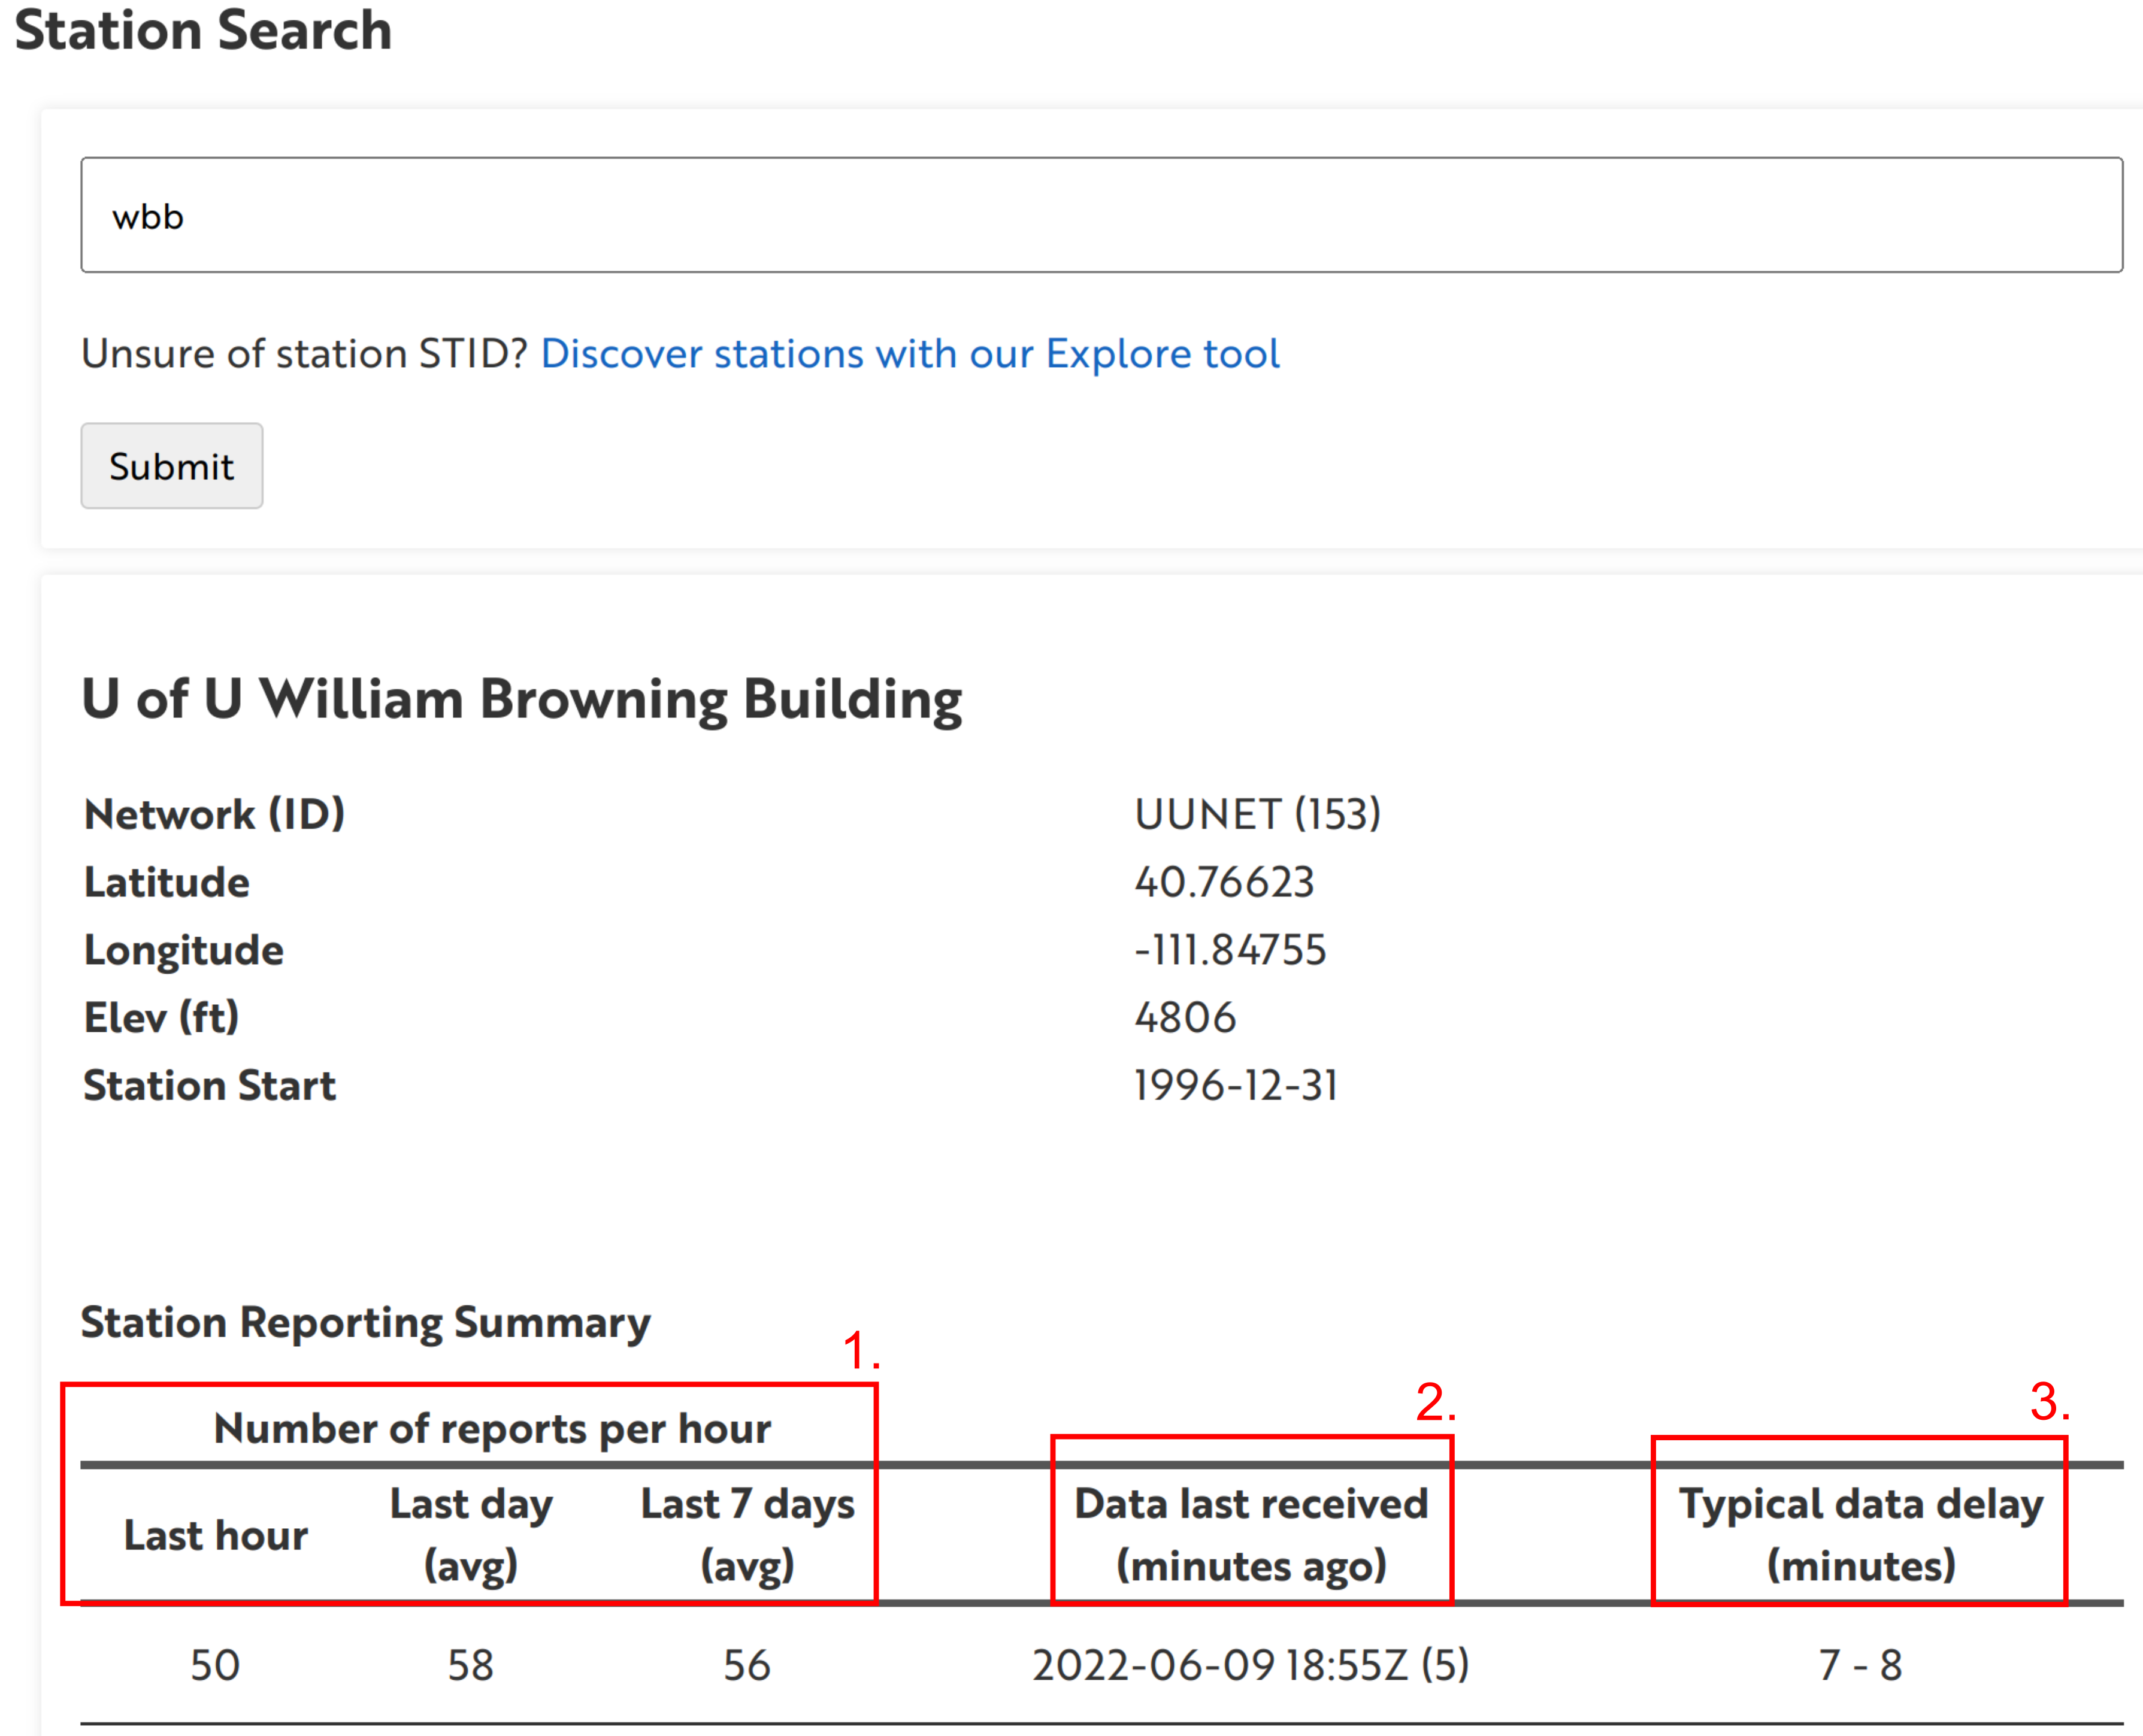
1. Number of reports
This is the number of reports transmitted by the station to Synoptic’s system in a one hour period. As with the network metrics, 24 hour and 7 day summaries are the average number of hourly reports over the respective time periods. Note: Synoptic periodically receives historical station data to fill data gaps. In these instances, the station report counts may exhibit short duration increases.
2. Data last received
Similar to the network metric, this is the time of the most recent station data transmission (to the nearest 5 minute increment). It is not synonymous with the timestamp of the most recent station observation. The time passed since the last data transmission is also presented in units of minutes.
3. Typical data delay
The typical delay between an observation timestamp and when it is available in Synoptic’s system. The definition of the ‘typical’ delay follows the network definition.
A note about the data
Synoptic Data aggregates surface mesonet data from more than 300 networks, comprising nearly 100,000 stations in near real-time. The hundreds of providers that make these data available for public benefit must choose measurement frequencies and data transmission intervals that align with their own individual needs/purposes. These can vary greatly depending on factors ranging from operational objectives to station by station power availability. For instance, a provider may measure conditions on hourly intervals, but power constraints may require that the transmission of these data to Synoptic occur once per day. Such situations would be reflected in the data delay for the stations comprising this network. Even stations within a given network may measure or transmit at varying intervals, which can result in significant daily variation in the network station counts.
Synoptic’s efforts to aggregate mesonet data from any and all providers means that the flow of data through our system is highly network-dependent and expected to vary over a range of timescales from daily to seasonal. Interpretation of the summaries and timeseries presented in the data availability dashboard must bear this variability in mind.
FAQs
Why do the lines in timeseries’ plots not align with the `Last Report` marker?
The step plots reflect variable values that are rolled up hourly at the top of the hour (:00). When viewed as a wall clock time that is approaching the top of the hour, this can result in a gap between the timeseries step plot and the Last Report marker.
Alternatively, many stations report once per hour. In these situations it is common for the Last Report marker to plot somewhere on the step plot’s most recent hourly interval. This indicates that the station has not reported since the most recent rollup at the top of the hour.